2025
The State of the
Merchant Report
We surveyed store owners and ecommerce professionals* for our 2025 State of the Merchant Report. Responses came from a mix of founders, leaders, and specialists.
Here’s the full breakdown of who weighed in below.
In partnership with:

Meet the merchants
Years in operation
Most of our respondents have established brands, with 34.7% having been in business for 10+ years.
Key Takeaway: Longevity is common—many brands are not new. They’re navigating more complex tech stacks, supply chains, and retention strategies.

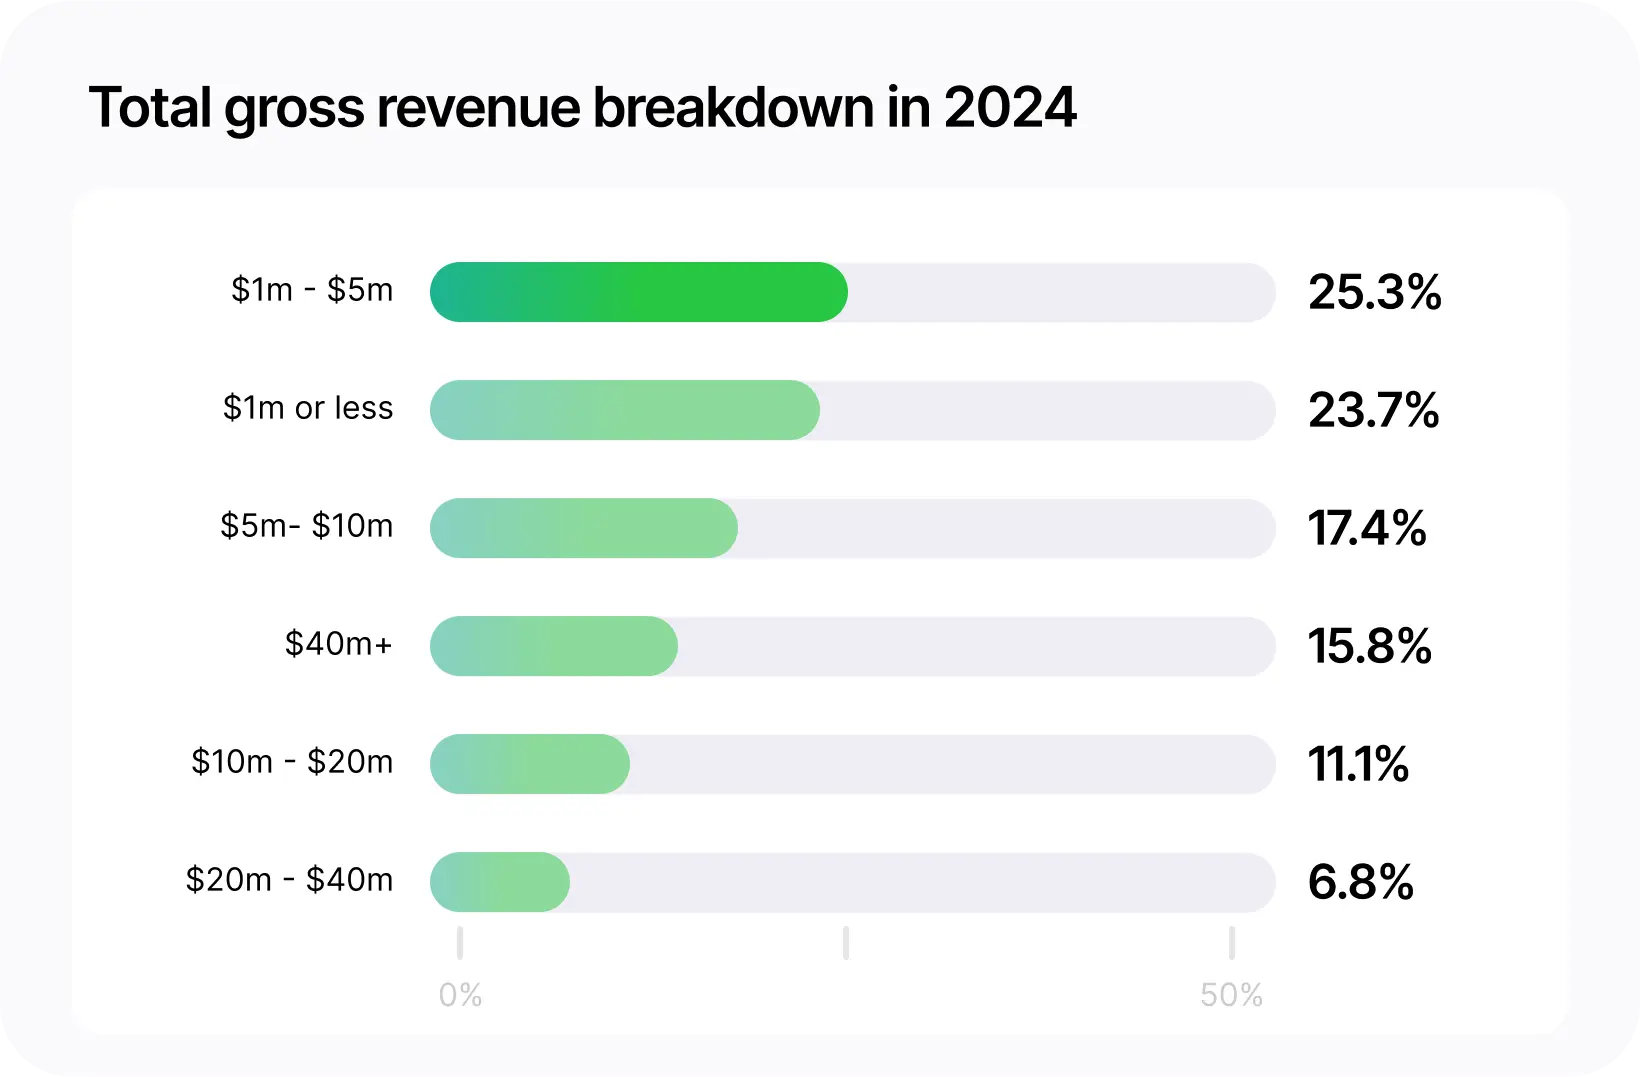
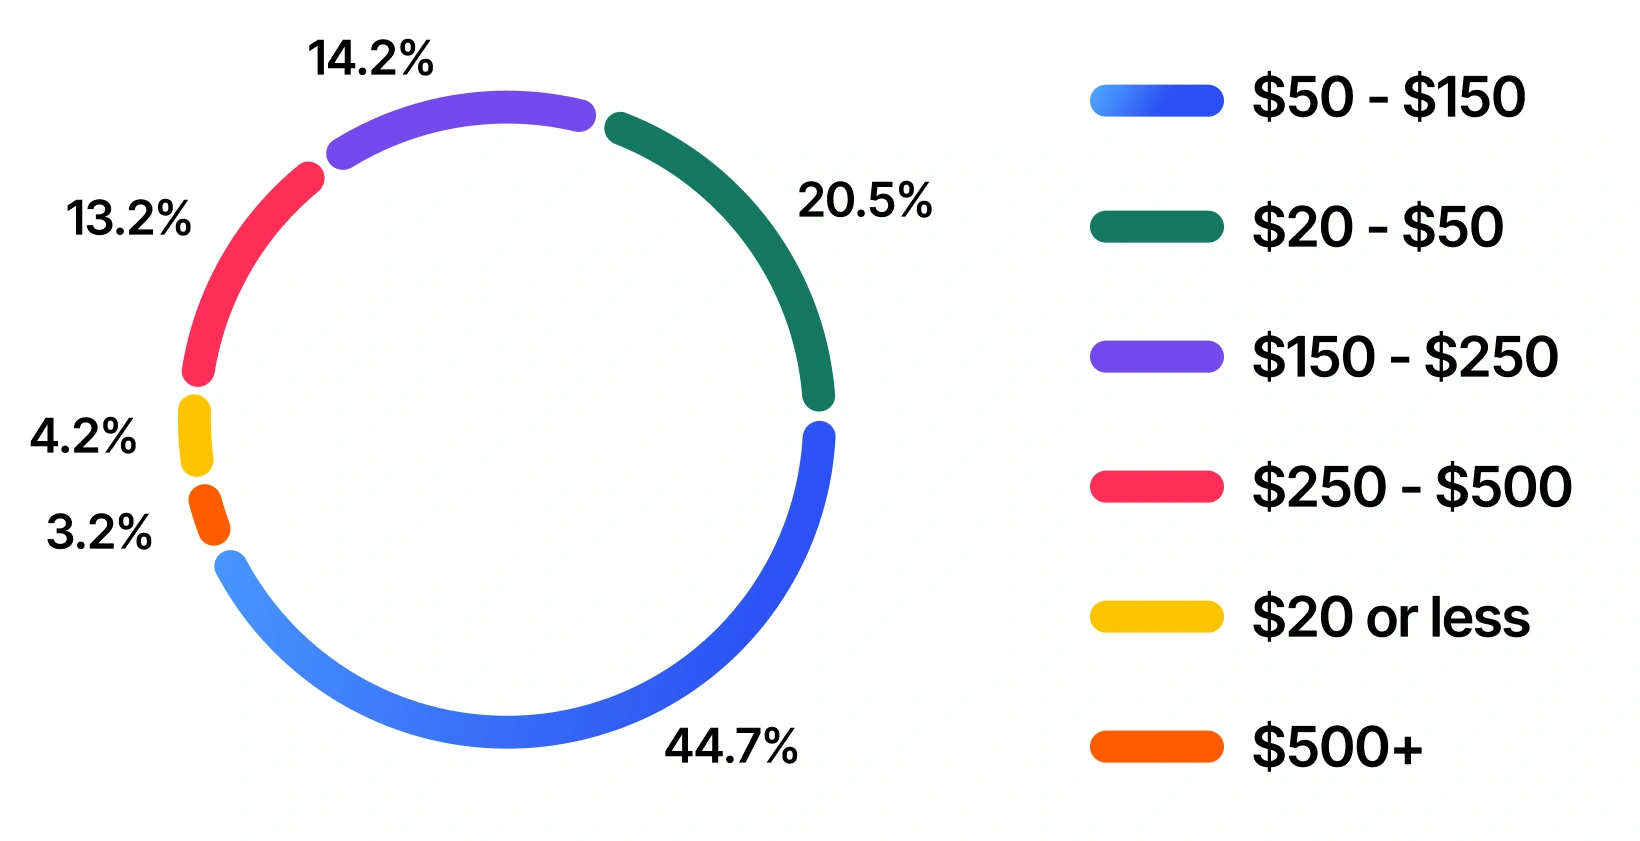
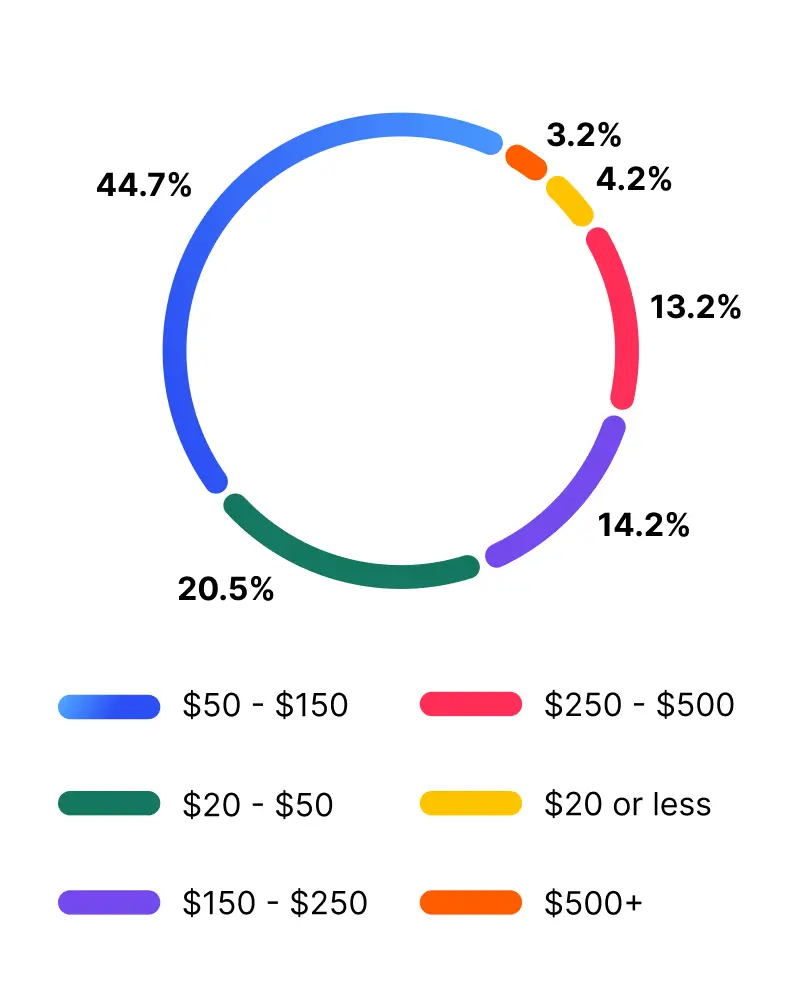
Average Order Value (AOV)
The majority of respondents fall into a mid-range AOV, 44.7% with an AOV of $50–$150.
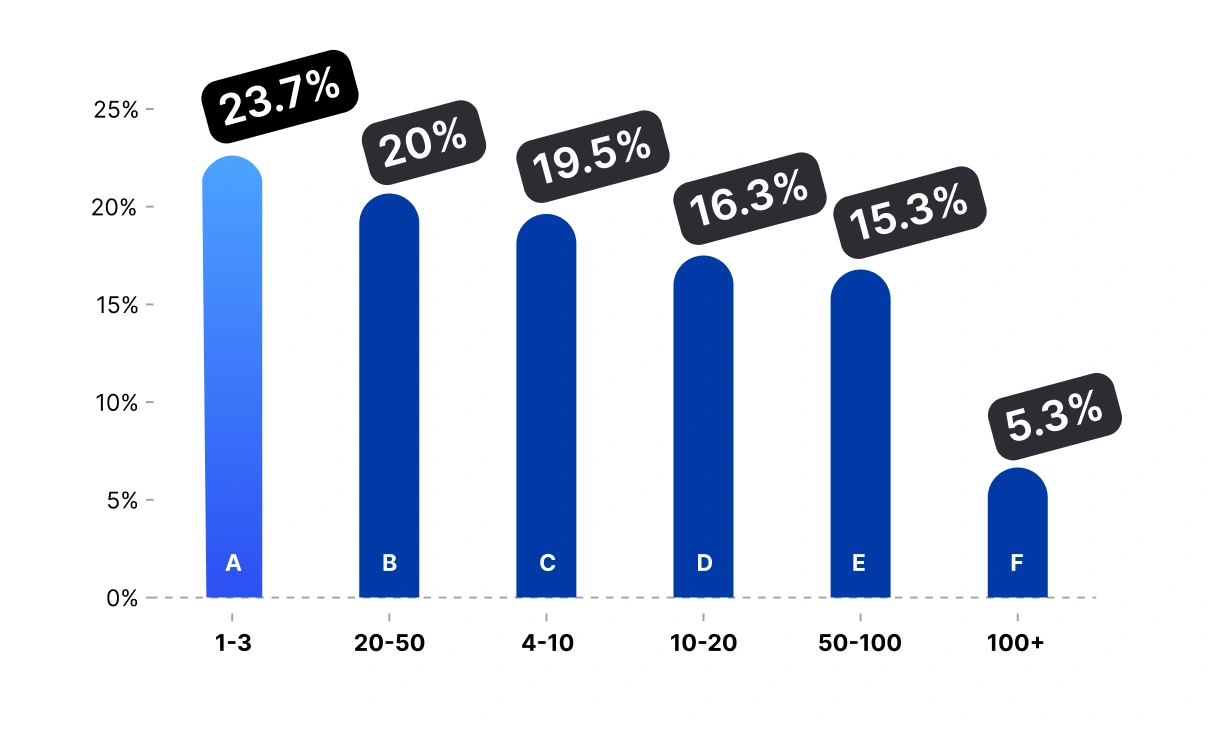
Full-time employees
A — 1-3 employees
B — 20-50 employees
C — 4-10 employees
D — 10-20 employees
E — 50-100 employees
F — 100+ employees
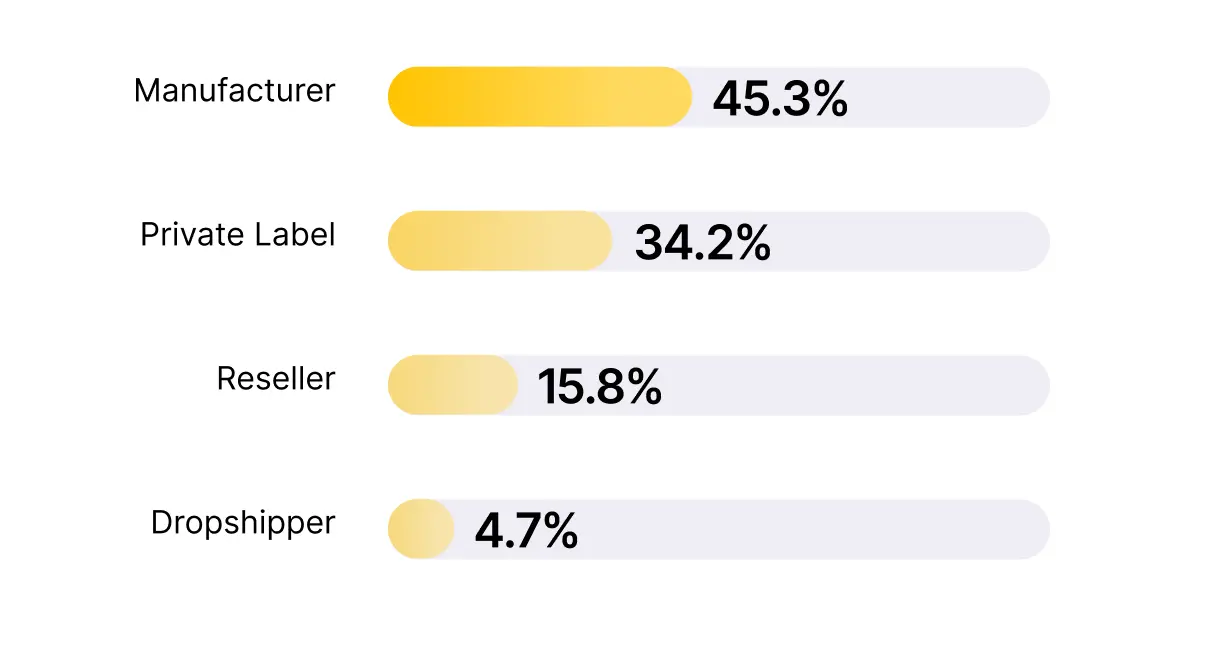
Business model
Owning the supply chain means more control, but also more margin pressure. The majority of merchants (45%) surveyed manufacture their own products, a demographic greatly impacted by tariff changes.
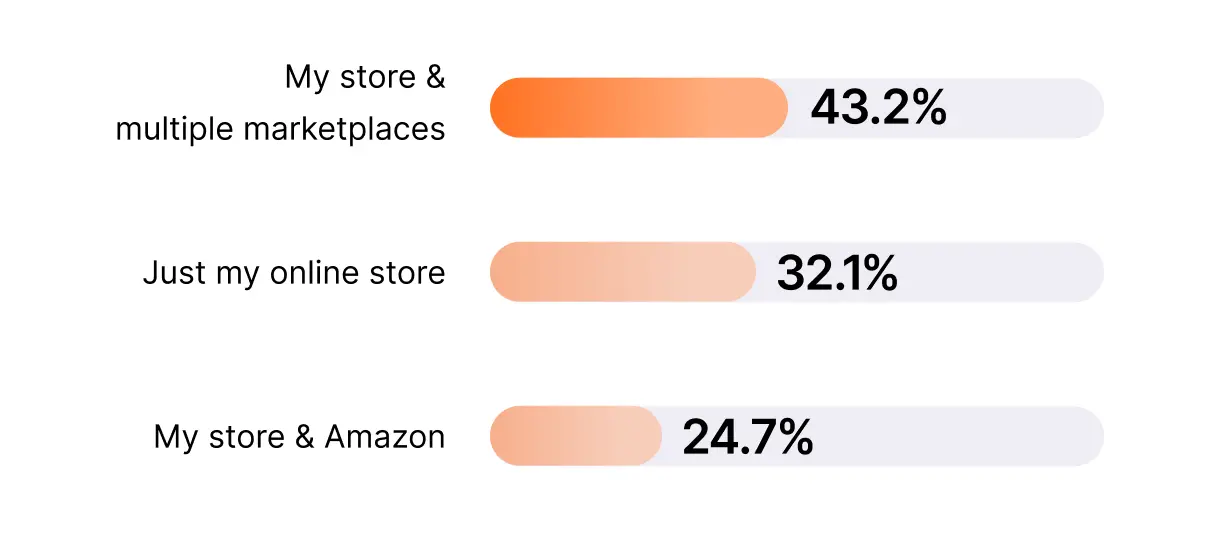
Where merchants are selling
Omnichannel is real. Attribution and list ownership matter more than ever when brands are reliant on their own store and multiple marketplaces (43.2%) and owned channels become increasingly crucial for retention.
“Being able to adapt as the economy and shopping habits are ever changing… Offering our products on both our website and Amazon has allowed us to reach more customers and redirect them back to our site.”
- Survey respondent on multichannel selling
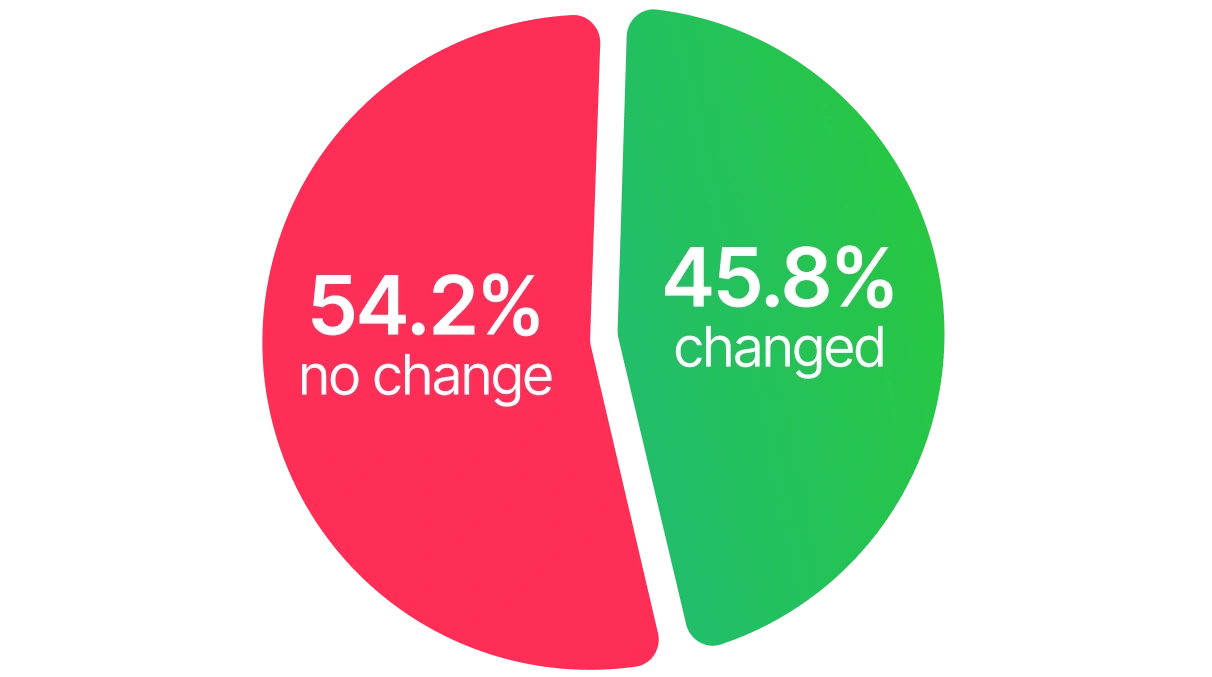
Nearly half of brands saw an improvement in net margin changes
This is the most optimistic signal in our report. Despite rising supplier costs (reported by 60.5% of respondents), almost half of merchants still managed to increase their net margins. That likely means brands are:
Raising prices selectively (though 31.1% didn’t raise prices at all)
Dialing in operational efficiencies
Doubling down on high-performing channels like email, SMS, and paid ads
“Meta spend is working for us. Investing in more inventory has helped us grow.”
-A survey respondent on paid spending
These brands aren’t just growing top-line revenue—they’re protecting (or growing) what actually matters.
For these merchants, margin compression may come from increased CAC, higher ops costs, or reliance on less efficient channels. They need more efficient, direct channels and better conversion tactics—fast.
Tariff Impact: What we’re seeing right now
When asked how tariffs had impacted businesses in the past 12 months, here’s what we heard:
Over half of merchants (56%) experienced a meaningful negative impact from tariffs—suggesting that international sourcing and cost control remain major concerns. For brands manufacturing or importing products, tariff pressure is real—and influencing decisions around pricing, fulfillment, and profit margins.
“When your brand is under tariff pressure, price changes hit the bottom line faster than shifting supply chains or cutting OPEX. It’s encouraging to see nearly 70% of brands making price adjustments. Volatility creates permission to experiment, just make sure you're taking a scientific approach, not guessing and hoping for the best. For the 30% hesitant to raise prices due to customer perception, remember there are other ways to reclaim margin, like adjusting free shipping thresholds, shipping rates, discounts, and bundle structures.”

Drew Marconi
CEO and Co-founder
What’s going on with ROAS?
“For the time being, we’re holding everything steady and taking a minor hit while the tariffs nonsense gets figured out.”
-A survey respondent on tariffs concerns
Free shipping threshold changes
It’s time to test those value props and see if free shipping is a powerful conversion lever for your brand.
“Offering free shipping may attract clicks, but it often comes at a steep margin cost, especially when shoppers still abandon carts due to delivery uncertainty. Instead, focusing on accurate, transparent shipping with tools like estimated delivery dates, brands can build trust and convert more effectively without sacrificing profitability.”

Aasif Osmany
VP of Revenue
“If you're under 2x ROAS, it’s time to go into surgical mode. Ruthlessly pause anything underperforming, rotate in fresh UGC and new creative weekly to combat creative fatigue, and start shifting budget to retention strategies. Don't sleep on website optimizations. Optimizing your mobile experience, page speed, and conversion flow can have a significant impact at this stage.”

Zach Rego
Chief Revenue Officer
Biggest growth levers
We allowed merchants to weigh in on the initiatives or strategies that had the biggest impact on their growth in the past year. They’re prioritizing profit-driven growth, channel diversification, and operational efficiency in response to rising costs and shifting customer behavior.
Performance Marketing Is Evolving: While Meta and Google remain core, brands are diversifying into TikTok Shop, affiliate, CTV, and influencer-led UGC—paired with more creative testing and an emphasis on pROAS and first-order profitability.
Retention & Owned Channels: SMS, email, loyalty programs, and private communities (e.g., Discord, WhatsApp) are driving higher LTV and repeat purchase behavior.
Product Innovation & Merchandising: New product drops, bundling, and higher-margin category focus are fueling acquisition and margin growth.
AI & Automation: Brands are adopting AI for customer support, dynamic pricing, and campaign optimization to improve efficiency and reduce costs.
Cost Discipline: Many are pulling back on spend, rightsizing operations, and negotiating with suppliers to protect profitability, even at the cost of top-line growth.
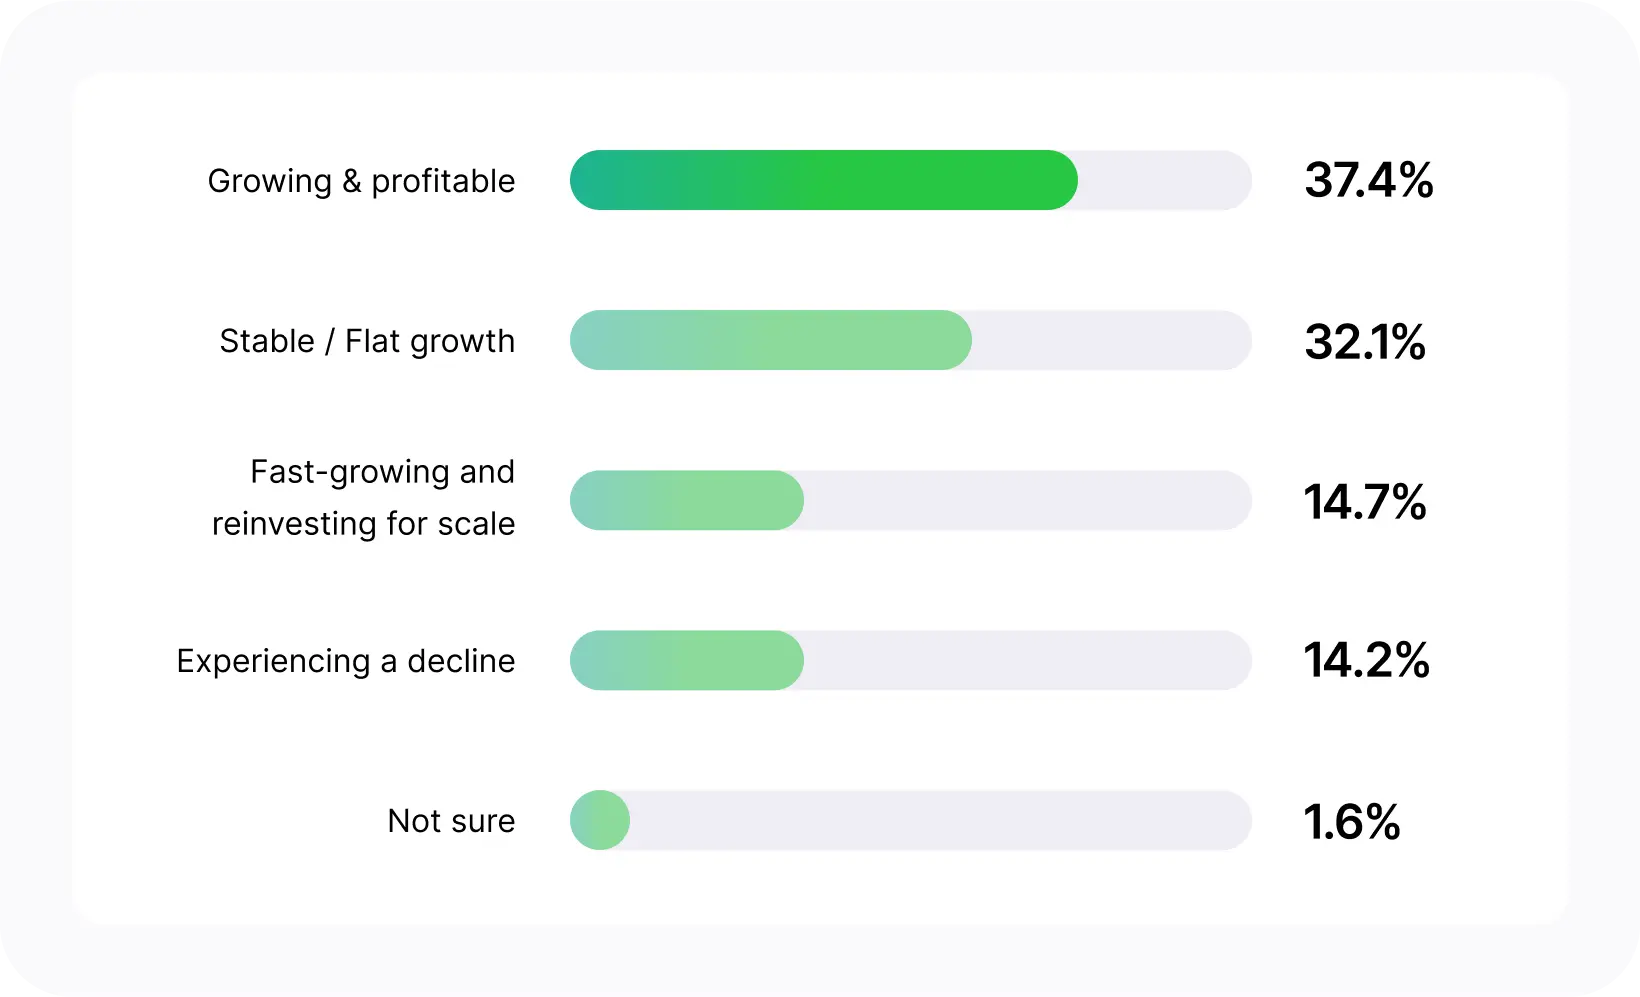
More good news on growth
The top response was growing and profitable (37.4%), while 1 in 3 are flat and 1 in 7 are in decline. Regardless of business status, merchants are looking for efficiency gains and performance help across all industries.
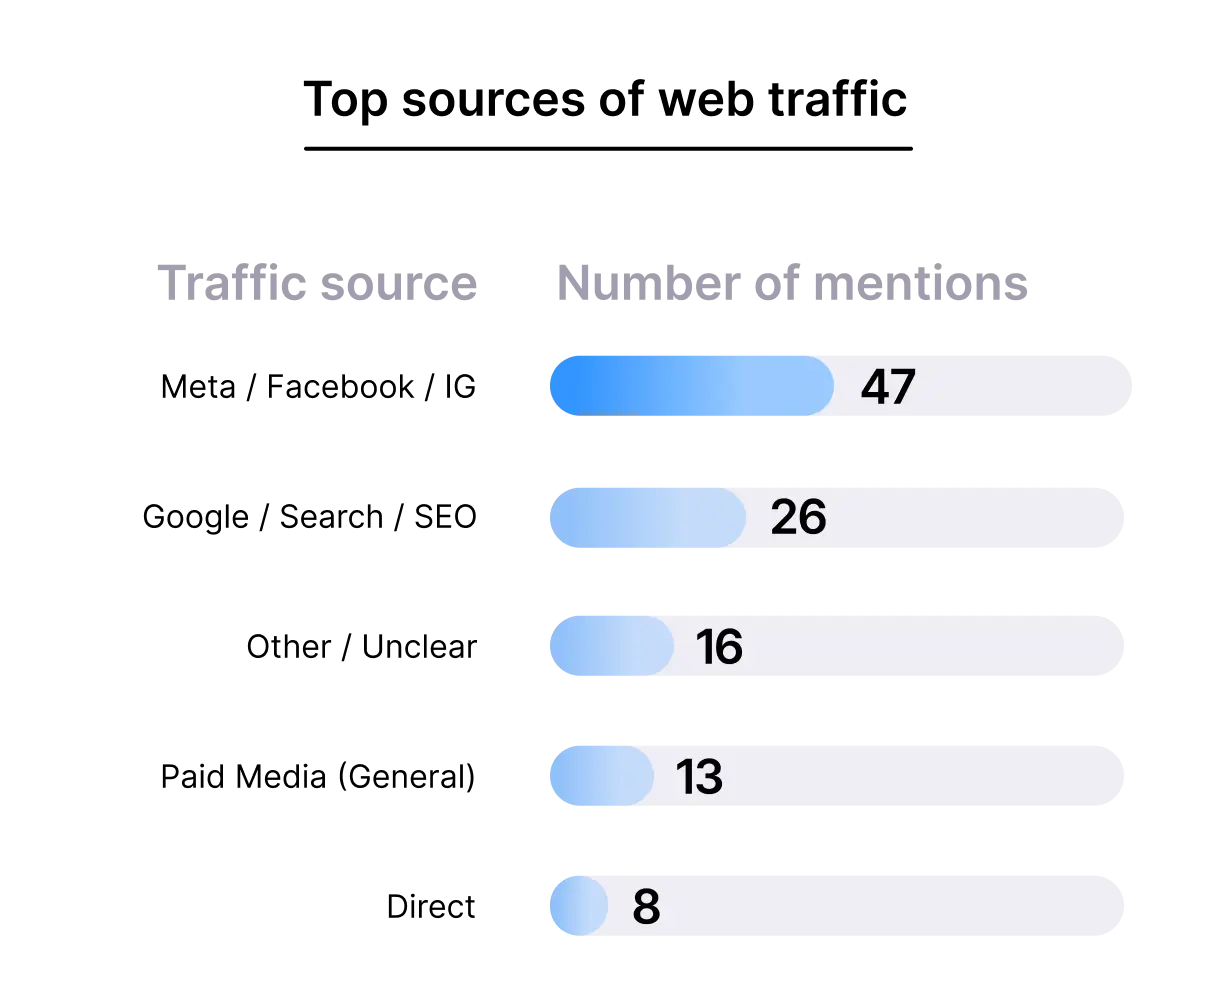
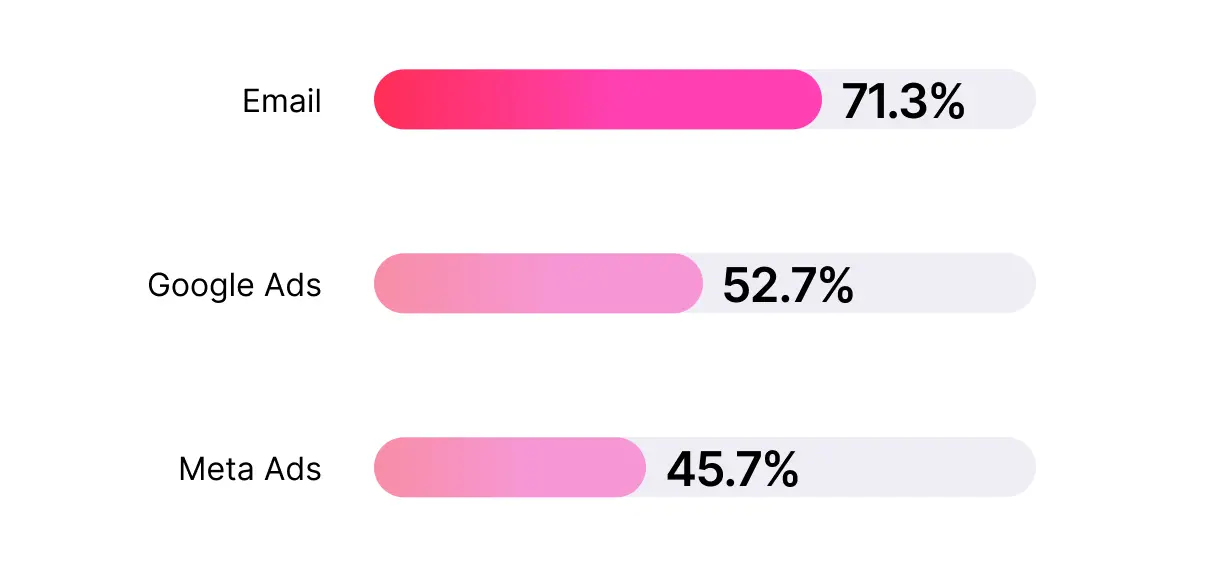
Top marketing channels by ROI
SMS is close behind at 41.5%—solidly competitive. Still room to grow share of budget and mind.
Top 3: Email (71.3%), Google Ads (52.7%), Meta Ads (45.7%)
Key Takeaway: Paid traffic remains impactful, but brands looking to diversify are leaning into owned channels like email and SMS.
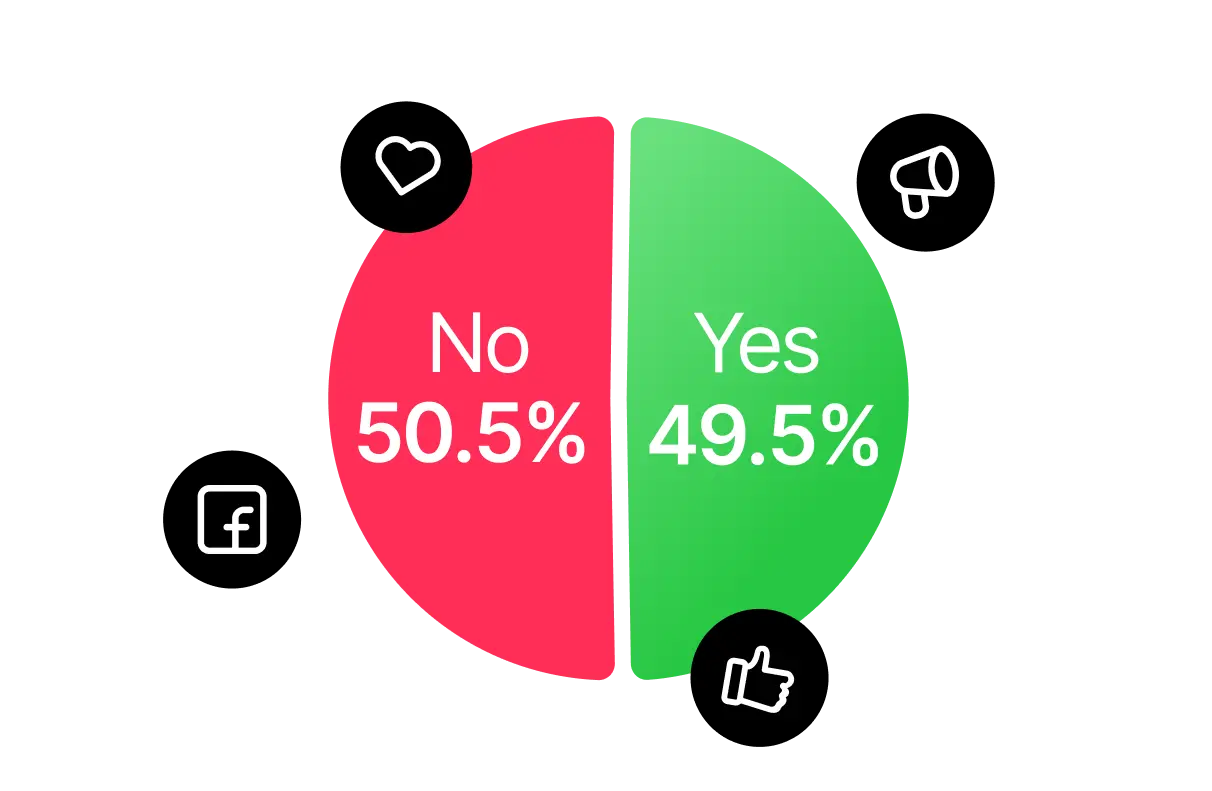
Facebook ads diversification
Trust in Meta is divided. This opens the door for brands to try other owned and paid channels.
Even Split: 50.5% no, 49.5% yes
Growth channels and growing pains
From subscriptions to wholesale to who’s packing the boxes — this is where operations meet opportunity.


“The brands that will dominate in 2025 understand one fundamental truth: your returning customers should never feel like strangers when they come back to shop. The moment a customer returns to your site, they should be recognized, remembered, and served an experience that feels tailored just for them, with instant access to their history, favorites, and earned benefits. When you remove the friction between a loyal customer and their relationship with your brand, you’re improving their experience, unlocking 40-60% higher conversion rates, and transforming one-time buyers into lifetime advocates. The most successful brands we work with have realized that treating returning customers like VIPs is the fastest path to sustainable growth and profitability.”

James Dohm
COO
It’s never to soon to talk BFCM
Top Response: Email (88.3%), SMS (77.1%)

Nearly 4 in 5 brands plan to use email and SMS during BFCM campaigns—which means competition for attention will be fierce.
Here’s some tips on how to stand out in the inbox this year:
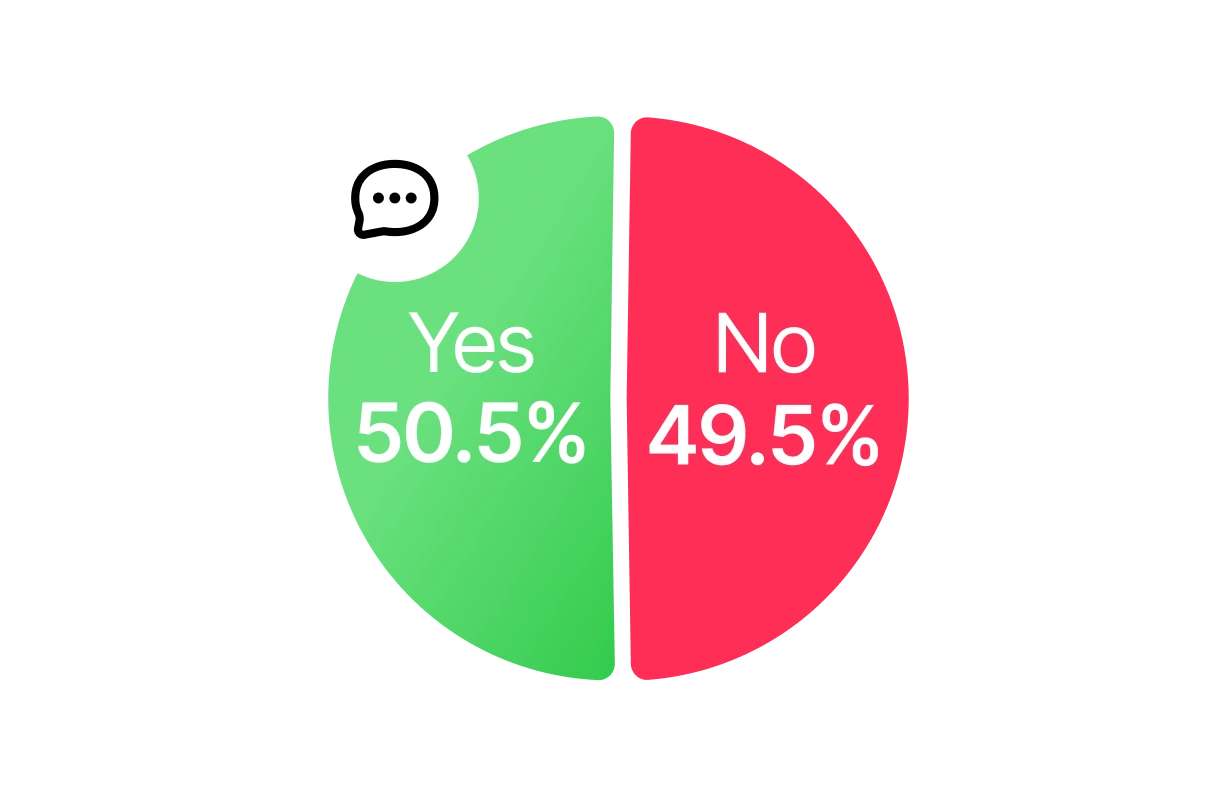
Conversational SMS Campaigns
Conversations are the future—but only half of brands are leaning in.
Even Split: 50.5% yes, 49.5% no
Tried and true tech favorites
These were the most talked about tech stack standouts—no big surprises here.
New tools added to the stack
These were the most talked about tech stack standouts—no big surprises here.
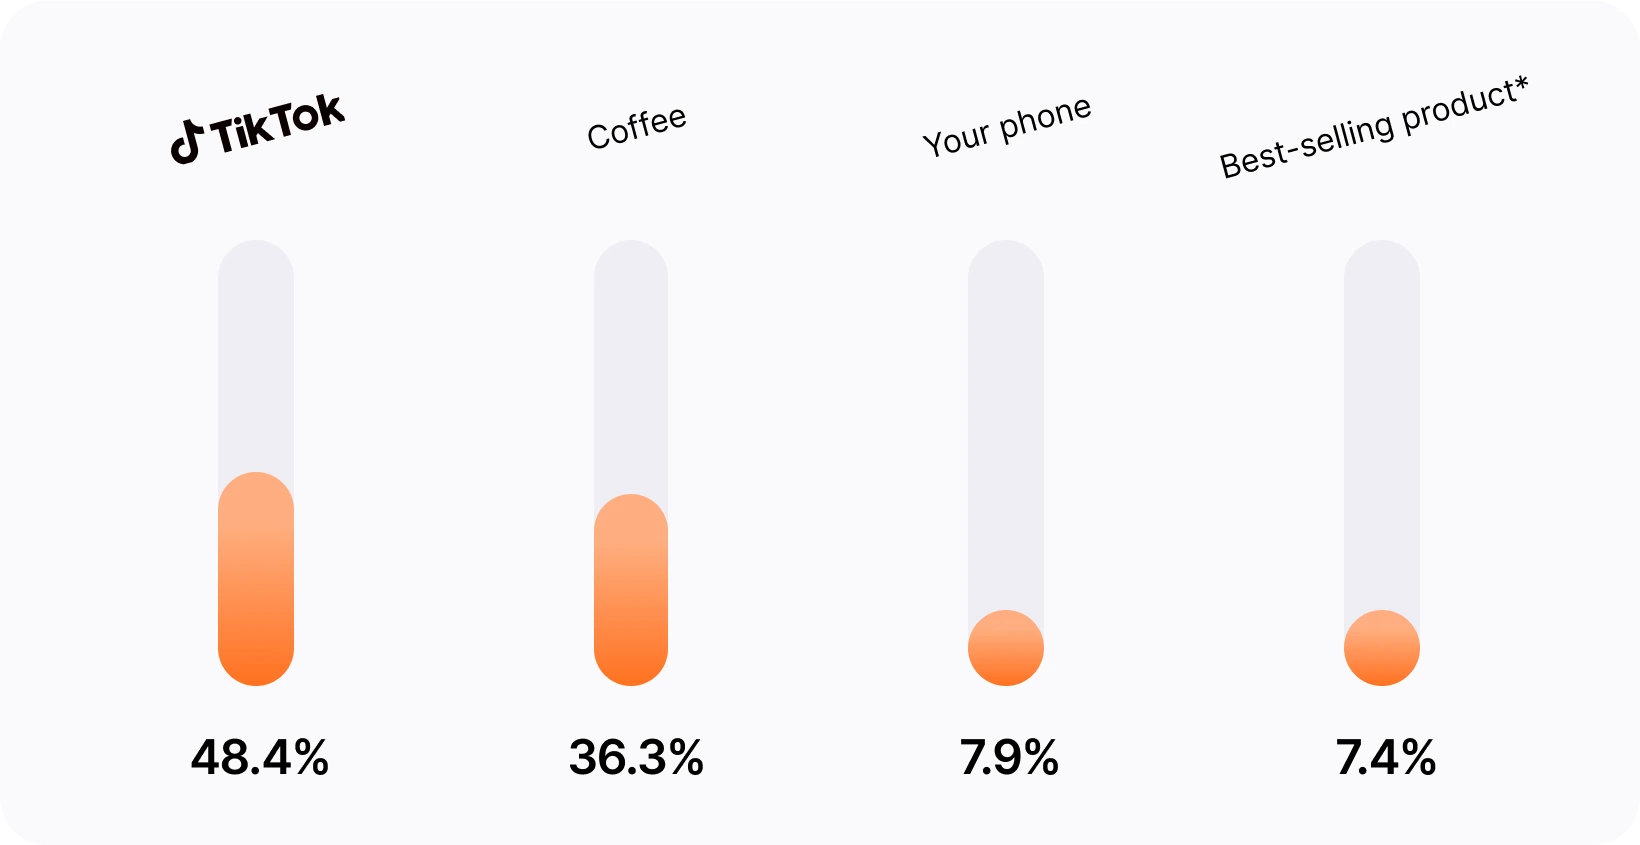
Here’s what ecom merchants would give up for a month
*We’re not surprised that this came in last place.
*This data was based on a survey amount of 190 respondents that work or own an existing ecommerce business.
** Nearly 1 in 3 responses were unclear, missing, or wildly inconsistent (e.g. “45”, “425”, “$900000”, “A lot”). This suggests many brands aren’t fully confident in their ad reporting or don’t have clear attribution—so take this into account when looking at the numbers above.