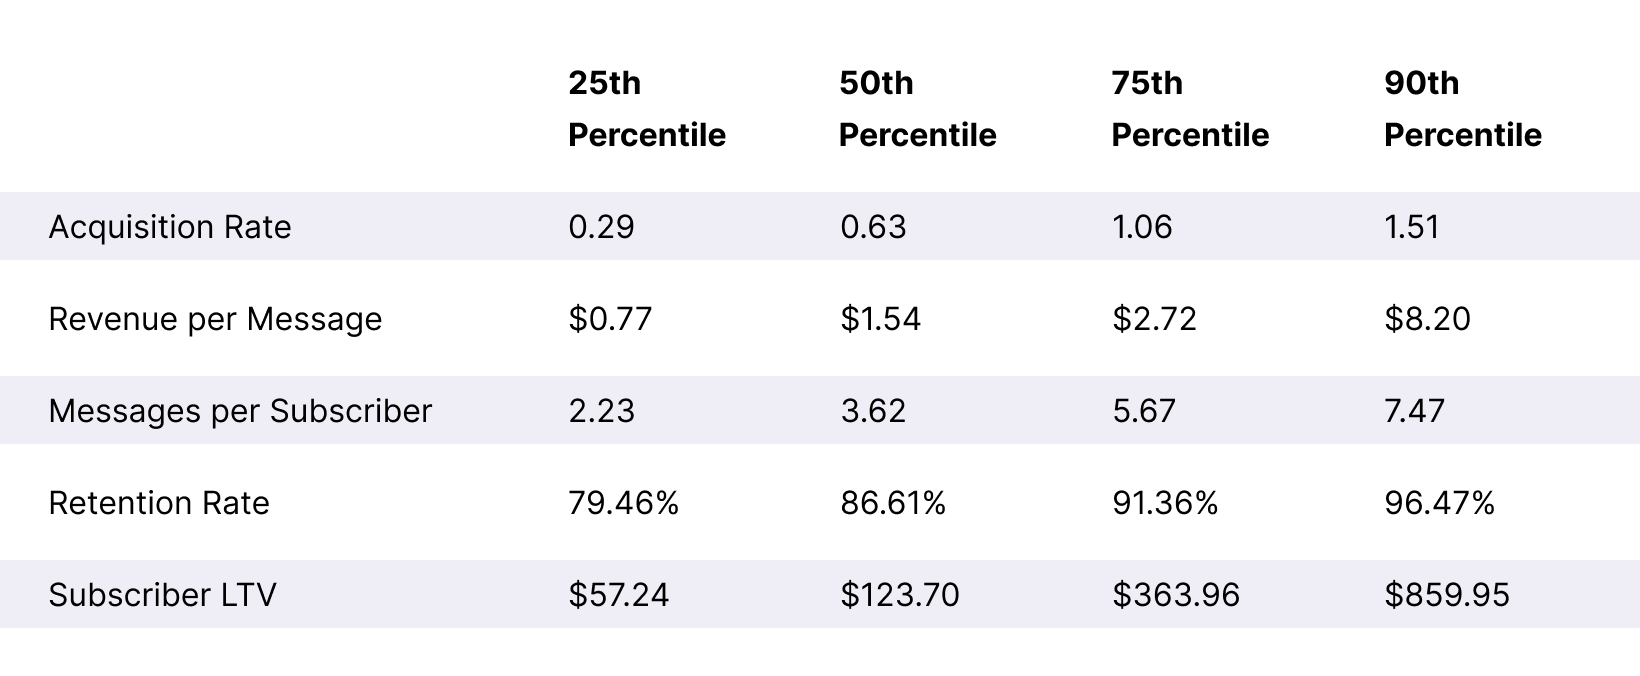
The proof is in the data:
Use these insights to create better SMS marketing campaigns in 2024. Below you’ll find the aggregate data from thousands of ecommerce stores using SMS, so you can see how your brand’s SMS marketing strategy stacks up. We’ve also included actionable takeaways to help you get the most out of this report.

Home Goods
Home is where the heart is, so set your heart on these Home Goods benchmarks—they won’t lead you astray.
SLTV + ARMR Benchmarks


Overall Message Benchmarks


Key Takeaways
The average Subscriber LTV for stores in the 90th percentile increased by 40% YOY. If you spent the last year focusing on SMS as a revenue channel, you’re likely seeing the benefits in your SLTV score. Better yet—take this as a sign to double down in 2024.
Make sure you’re leaning into both a Browse Abandonment and Abandoned Cart automation which perform almost neck-and-neck across this industry.
Benchmarks Methodology: Eligible Shops are those that installed 90 days prior to Black Friday (2023-11-25) and spent at least $300 on Postscript Marketing in Q4 2023. • SLTV + ARMR Benchmarks are averages at a merchant level across 2023, to account for seasonality. • CTR’s are calculated based only on sent messages that included a link. • A score is measured by dividing first time orders New Subscribers L30 / First Time Orders L30.