The proof is in the data:
Use these insights to create better SMS marketing campaigns in 2024. Below you’ll find the aggregate data from thousands of ecommerce stores using SMS, so you can see how your brand’s SMS marketing strategy stacks up. We’ve also included actionable takeaways to help you get the most out of this report.
See How Your SMS Program Stacks Up
Get the report and see how your strategy stacks up in your industry. We’ll also include best practices and advice from top-performing brands.
Benchmarks Methodology: Eligible Shops are those that installed 90 days prior to Black Friday (2023-11-25) and spent at least $300 on Postscript Marketing in Q4 2023. • SLTV + ARMR Benchmarks are averages at a merchant level across 2023, to account for seasonality. • CTR’s are calculated based only on sent messages that included a link. • A score is measured by dividing first time orders New Subscribers L30 / First Time Orders L30.
Benchmarks by Industry
Every industry has a different customer profile, different best practices for reaching those customers, and different expectations for their marketing efforts. In essence, there is no one-size-fits-all approach. After all, a ski shop and a baby food store probably shouldn’t text their customers the same way. We looked at the top 5 ecommerce industries and analyzed their success with SMS marketing to help you evaluate your own.


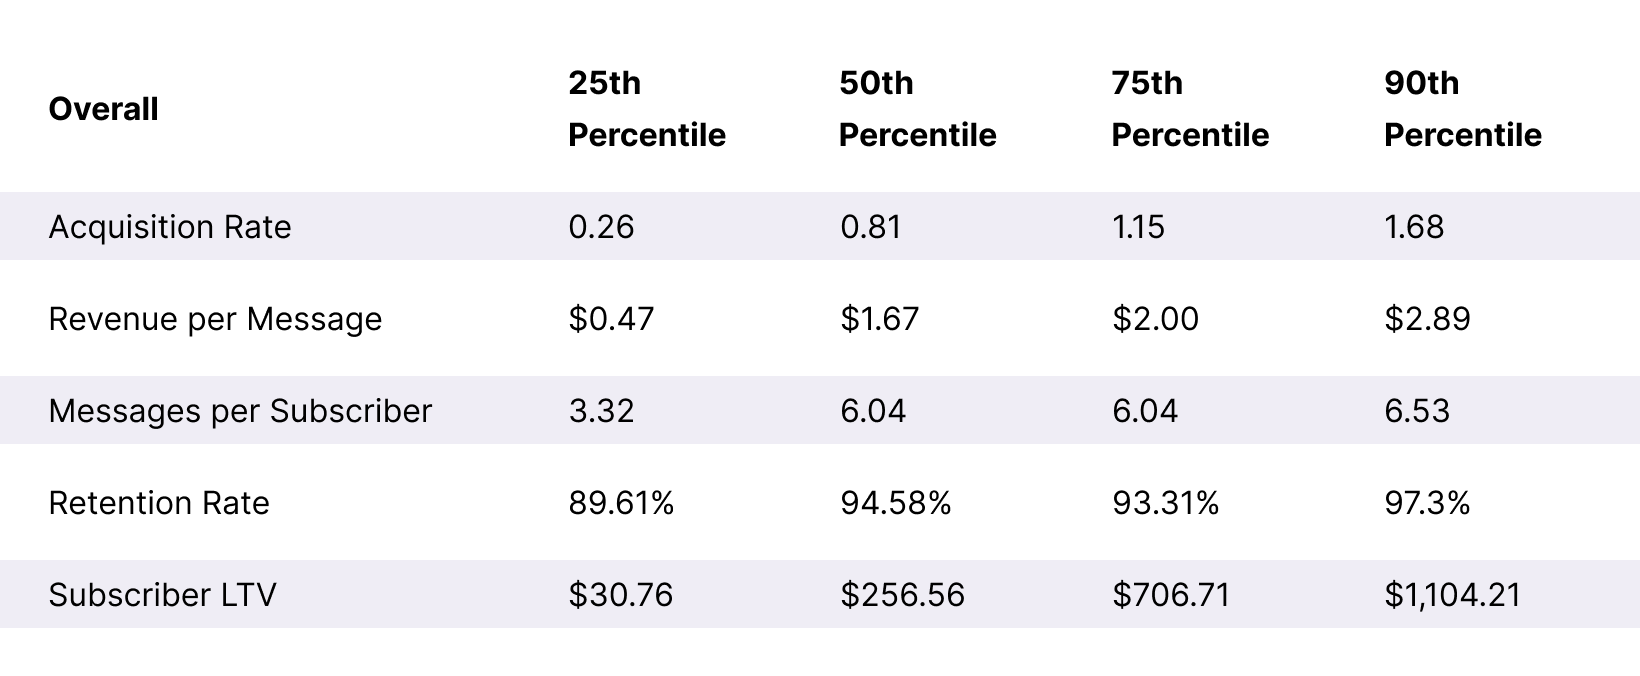
Overall Benchmarks
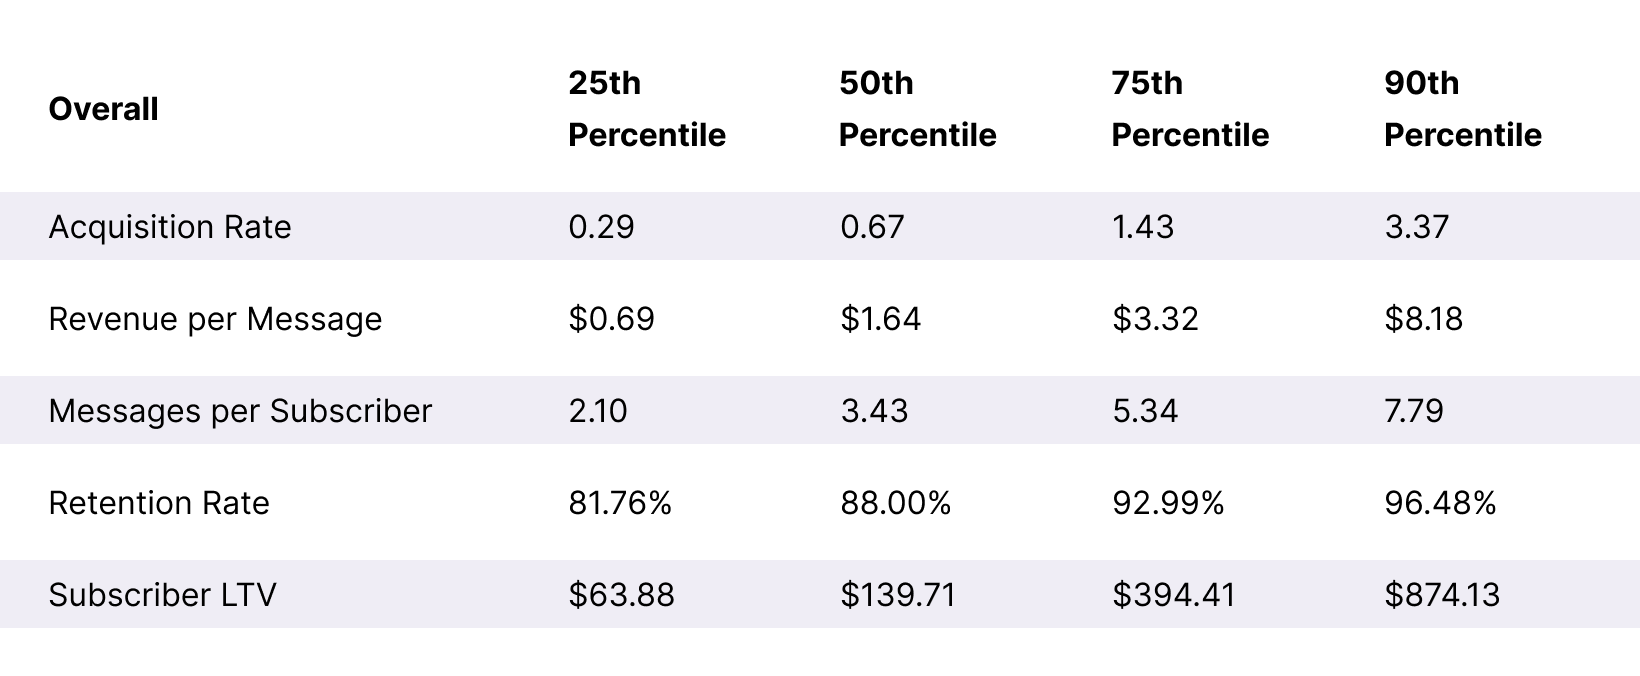
If your shop doesn’t fit into one of the specific industry categories featured in this report, these general numbers are a great starting point for assessing your SMS performance.
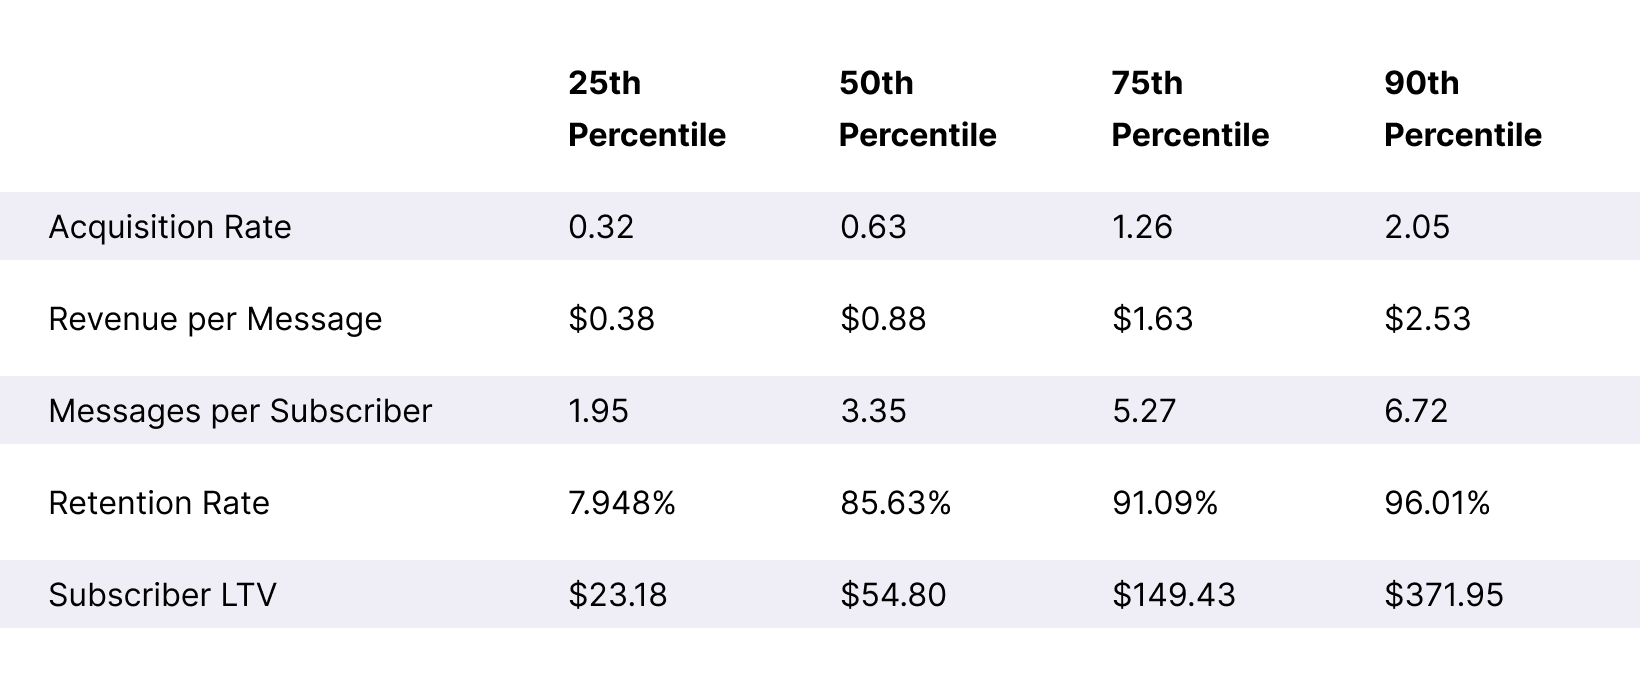
SLTV + ARMR Benchmarks

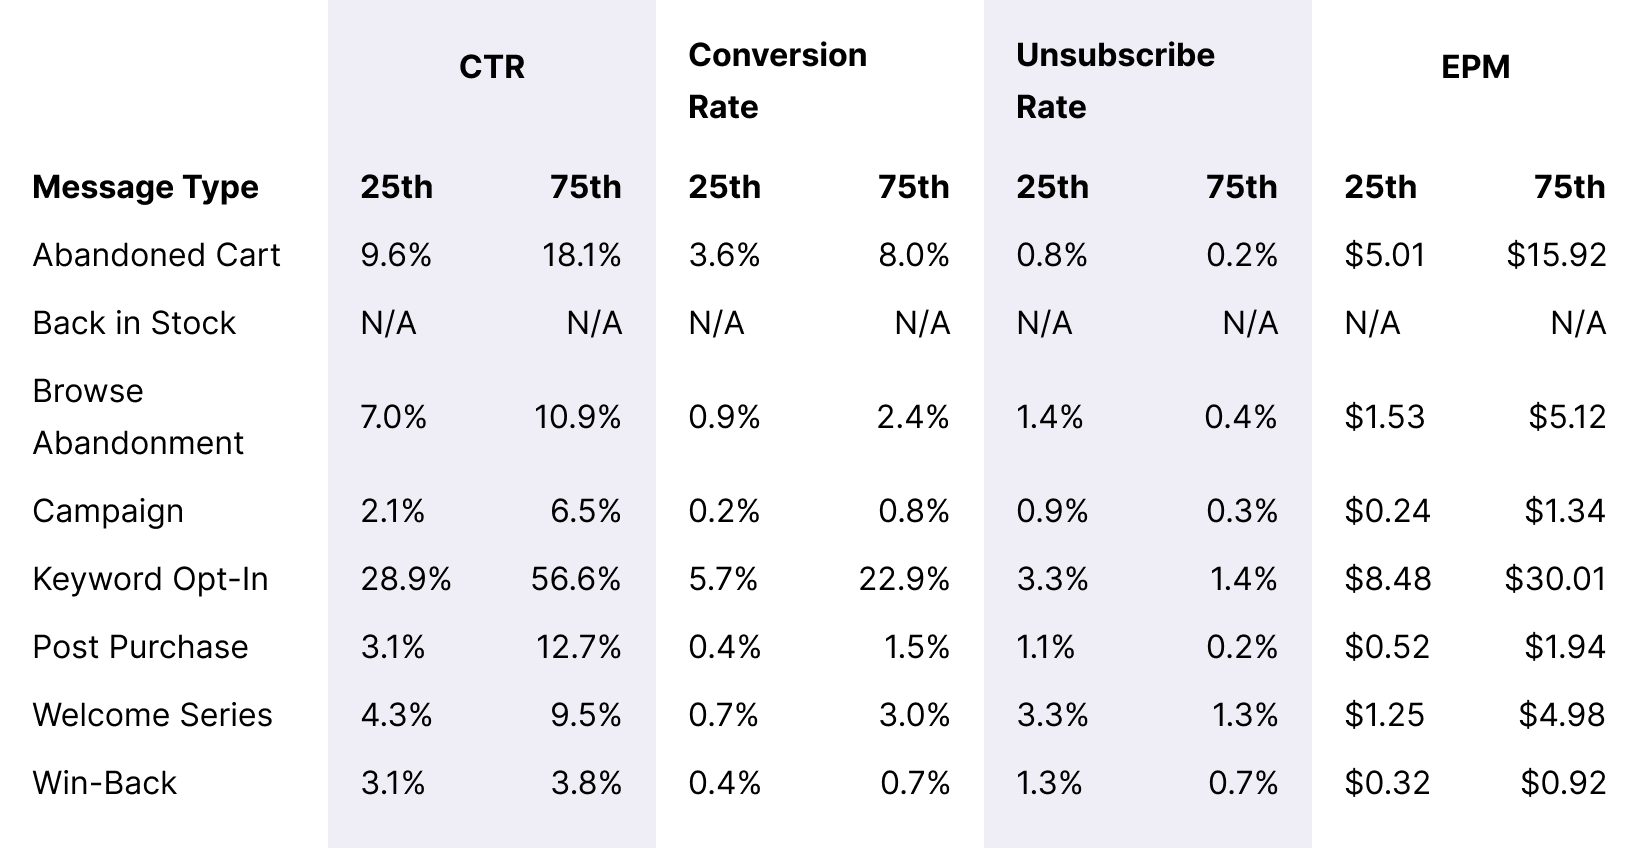
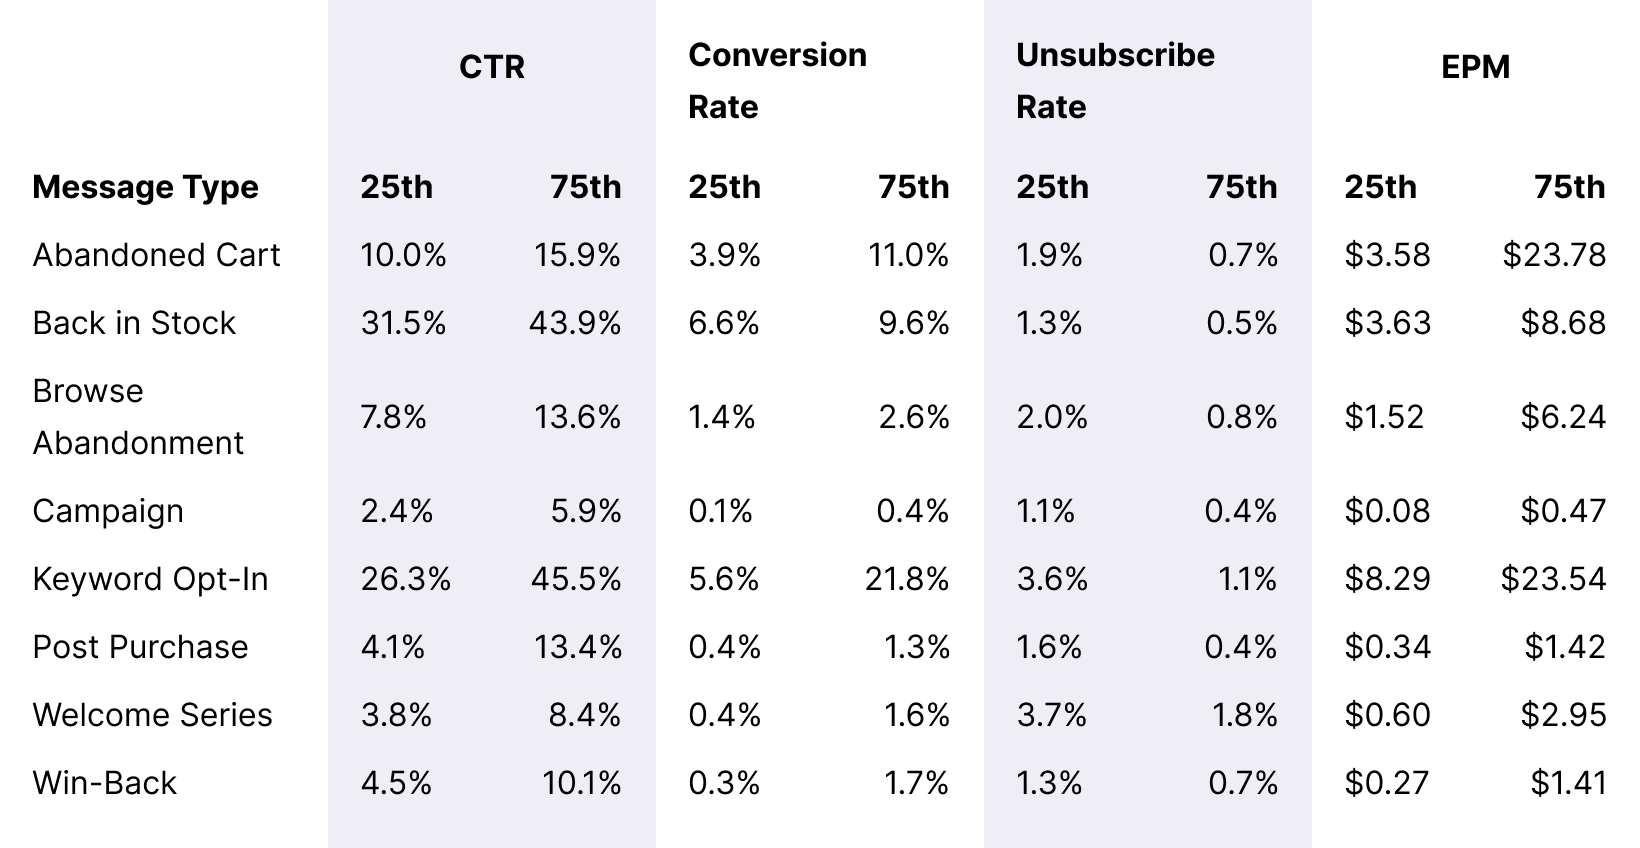
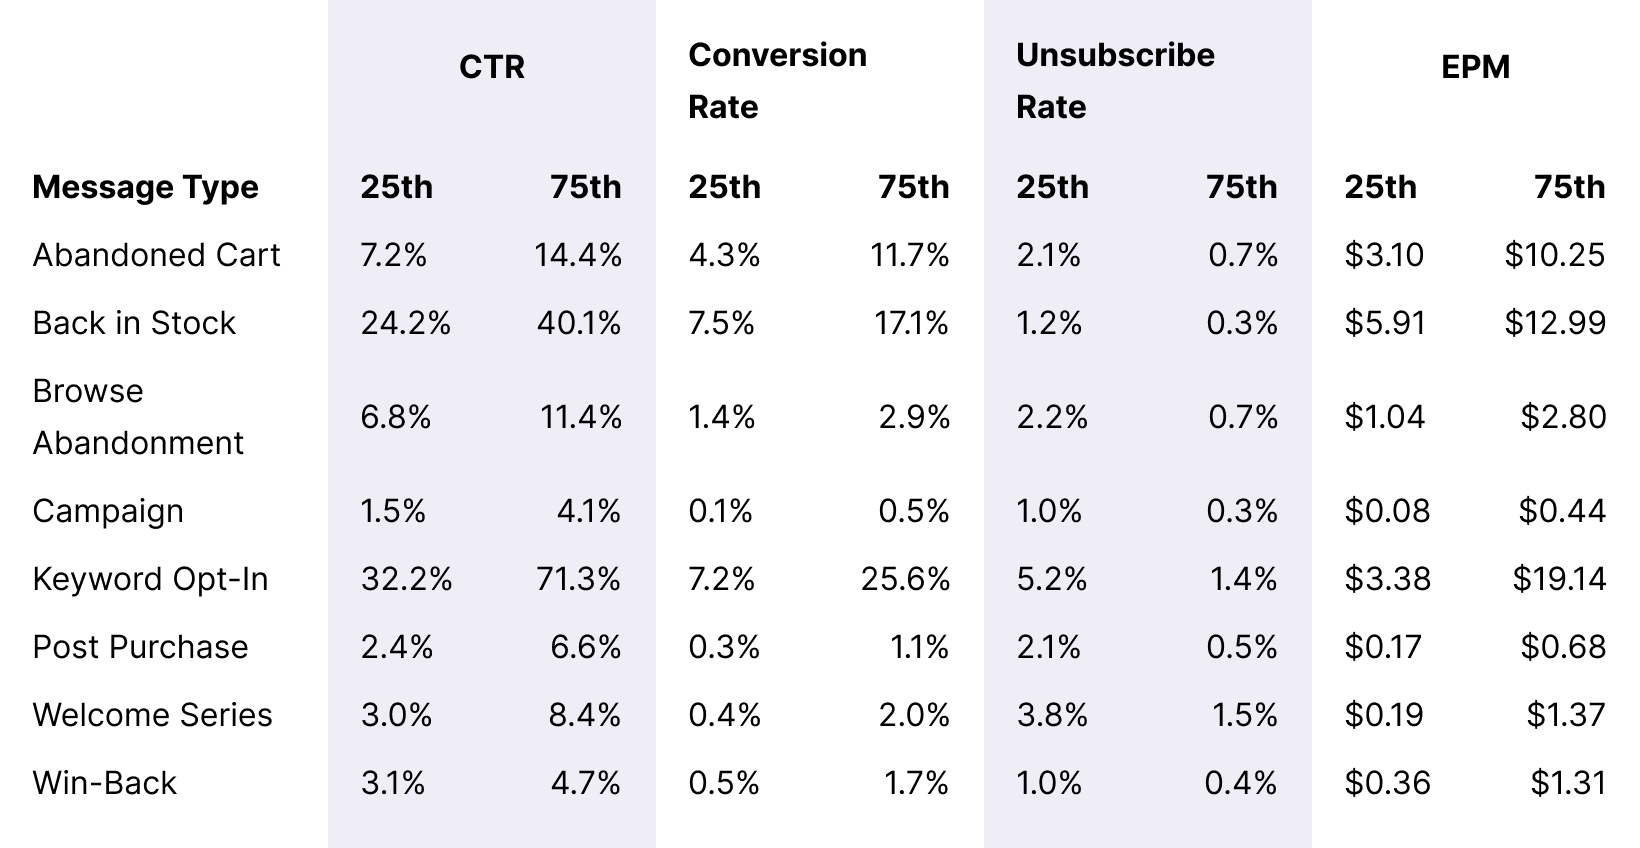
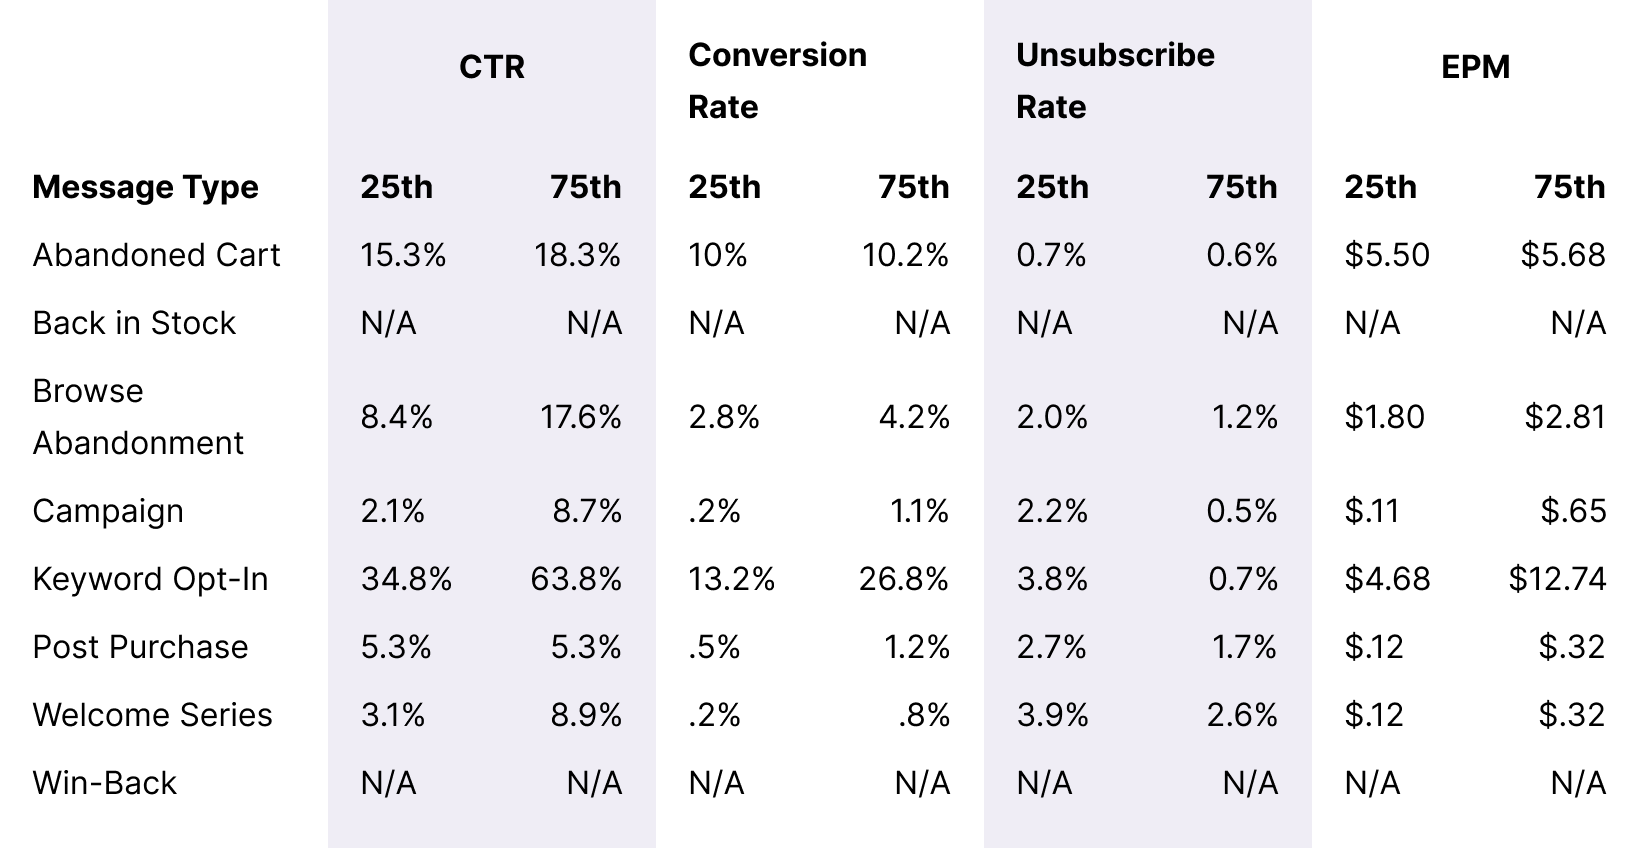
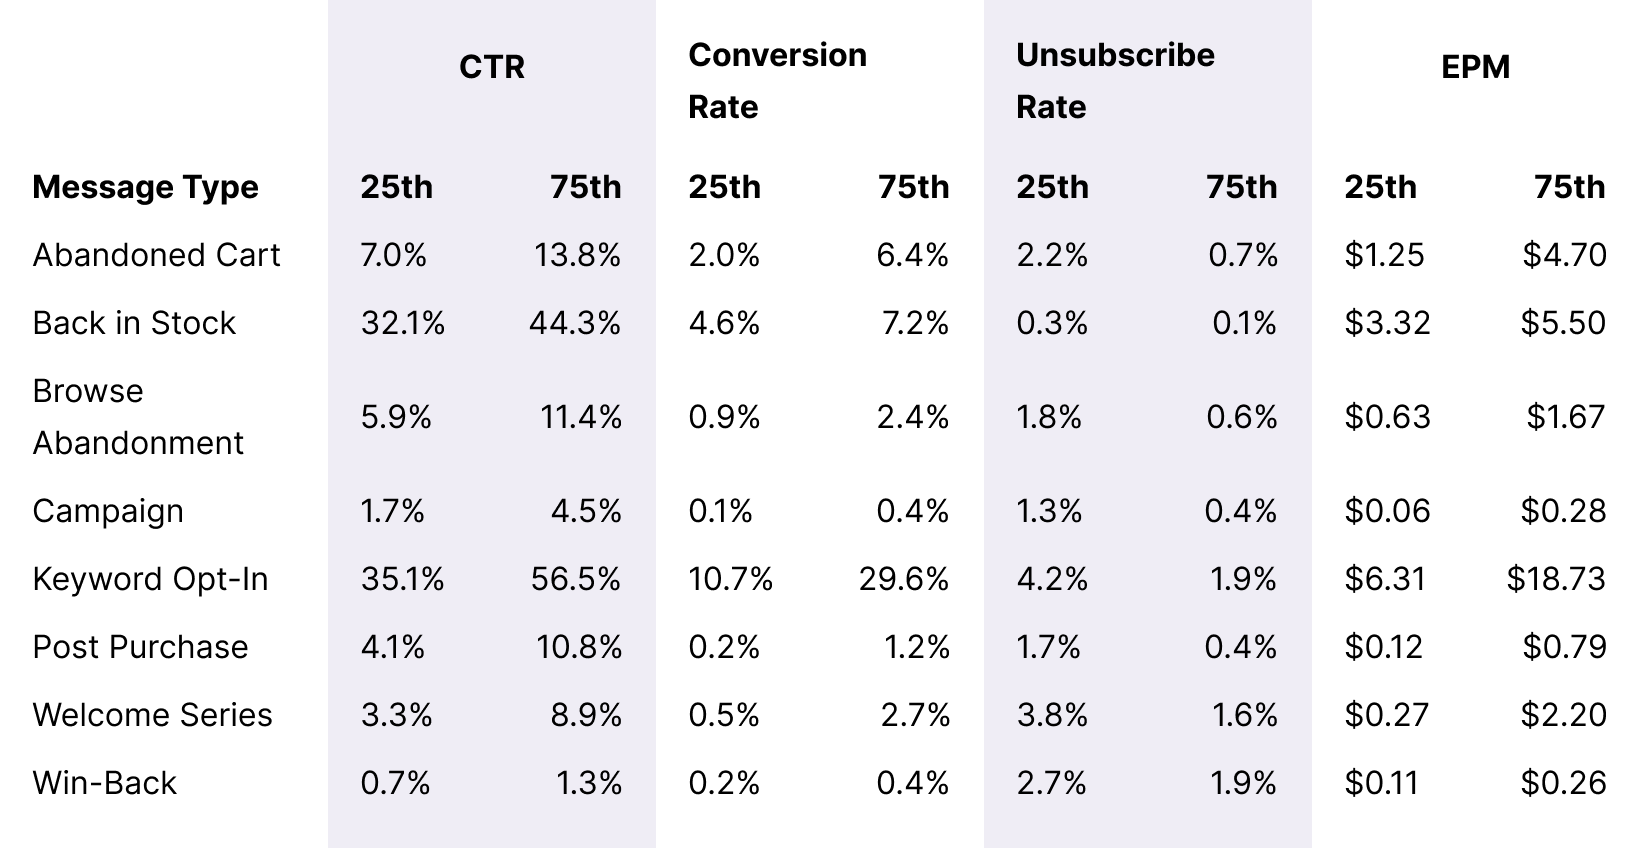
Overall Message Benchmarks
Key Takeaways
Every brand can benefit by using Back in Stock notifications. These subscribers are extremely high intent, which is evident based on the high CTR and EPM. Turn on Back in Stock notifications on your product pages to acquire more subscribers and see a big increase in revenue.
Welcome Series and Keyword Opt-In remained relatively unchanged year over year, with a slight increase for EPM performance for Keyword Opt-In. This is just another reminder that a more tailored, thoughtful Welcome Series experience is crucial in getting those new customer conversions.

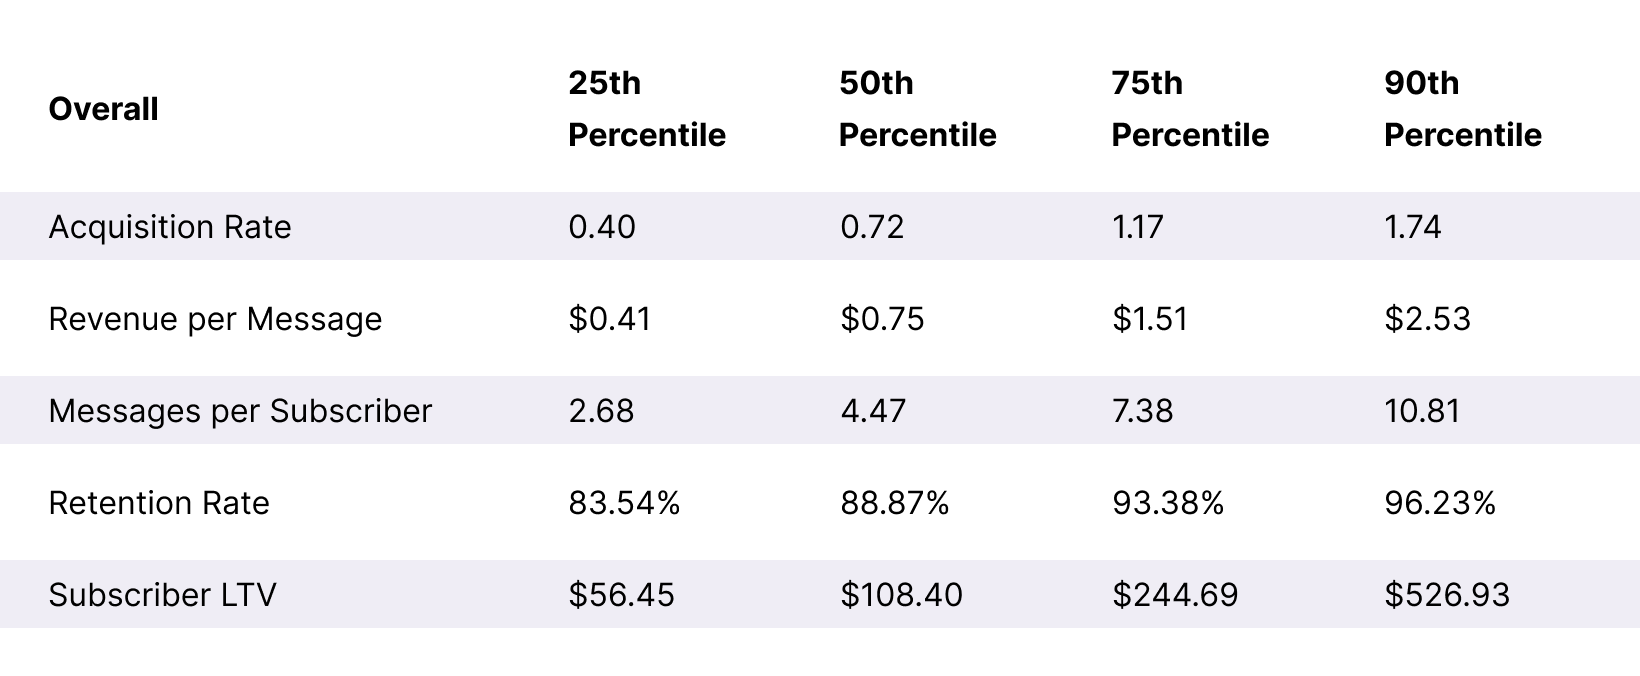
Fashion & Apparel
From streetwear to swim trunks and evening gowns to athleisure, apparel brands should try these SMS benchmarks on for size.
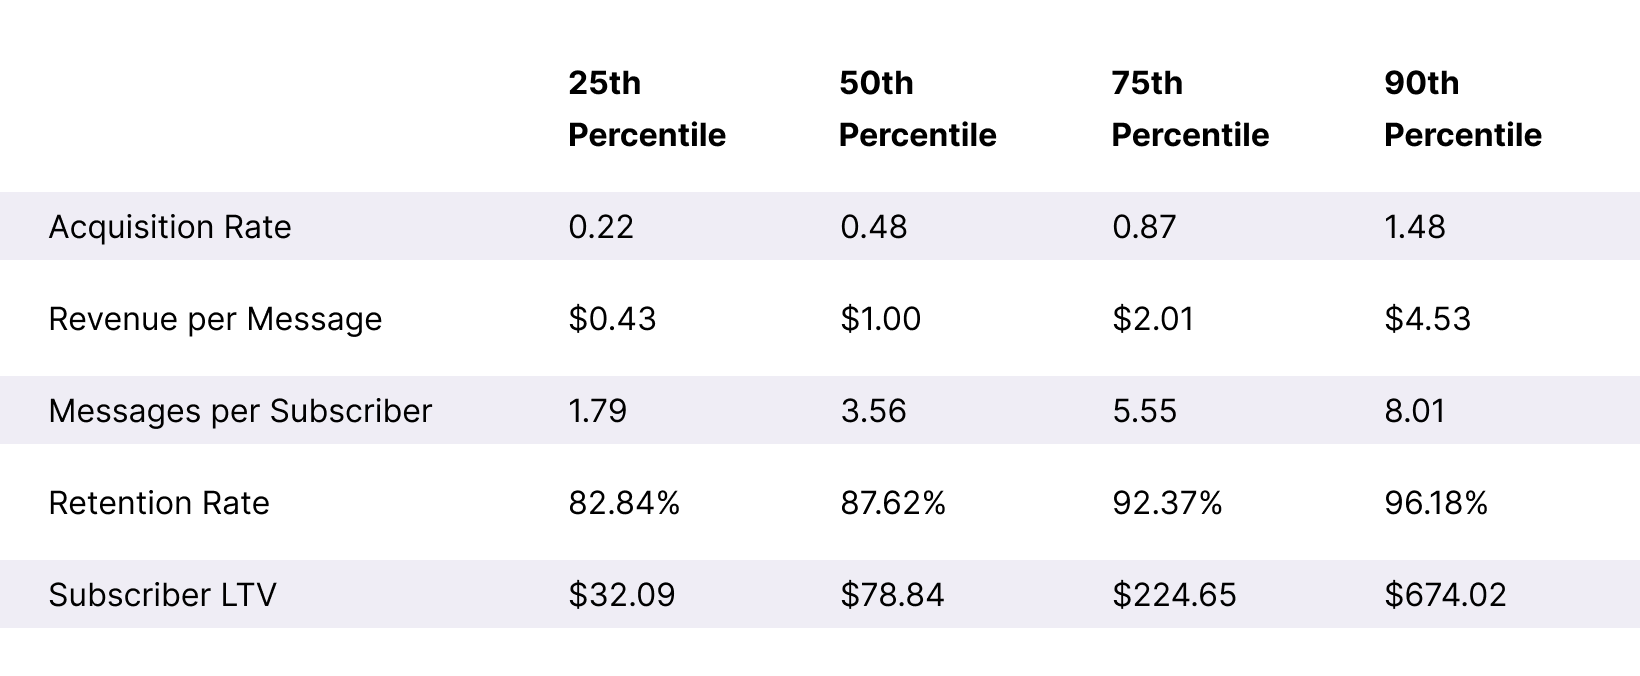
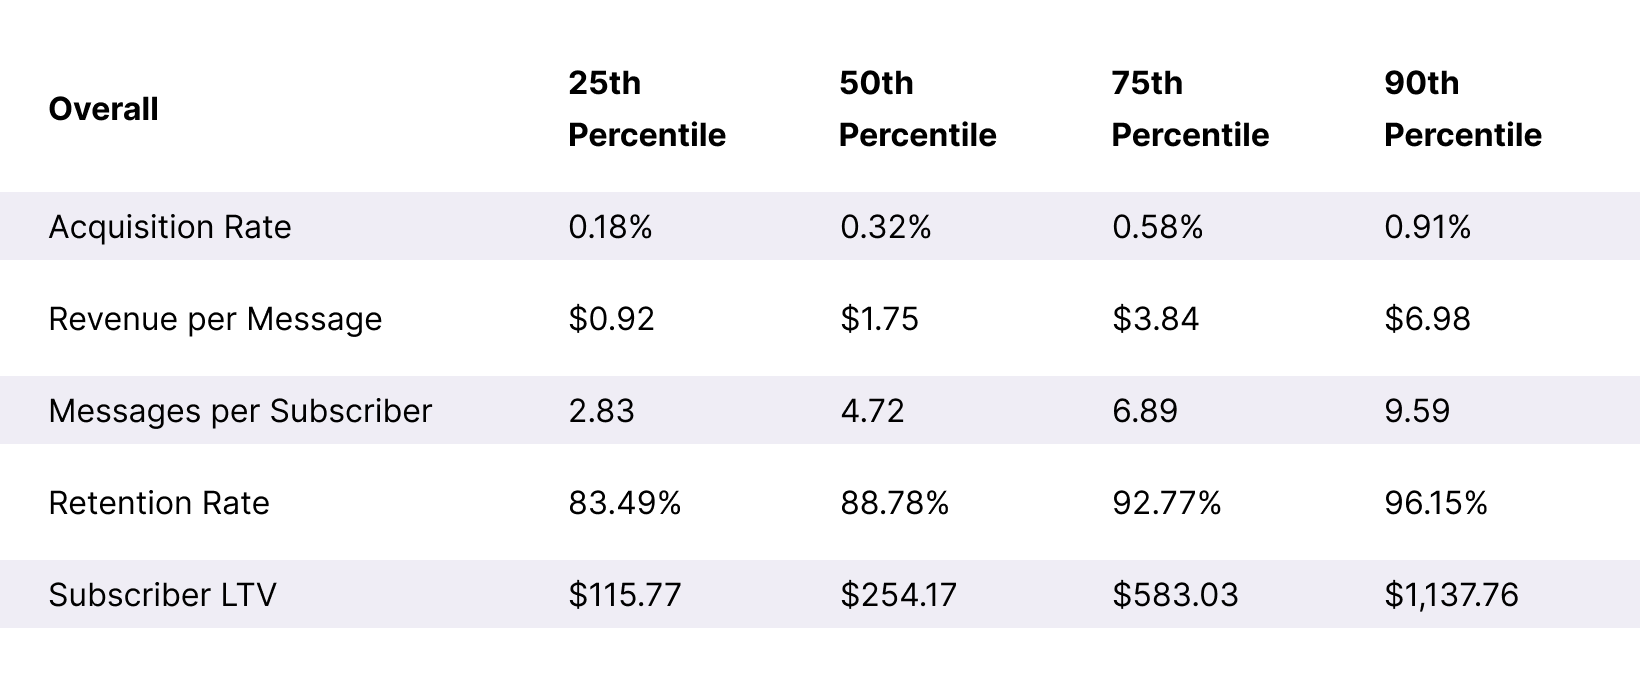
SLTV + ARMR Benchmarks

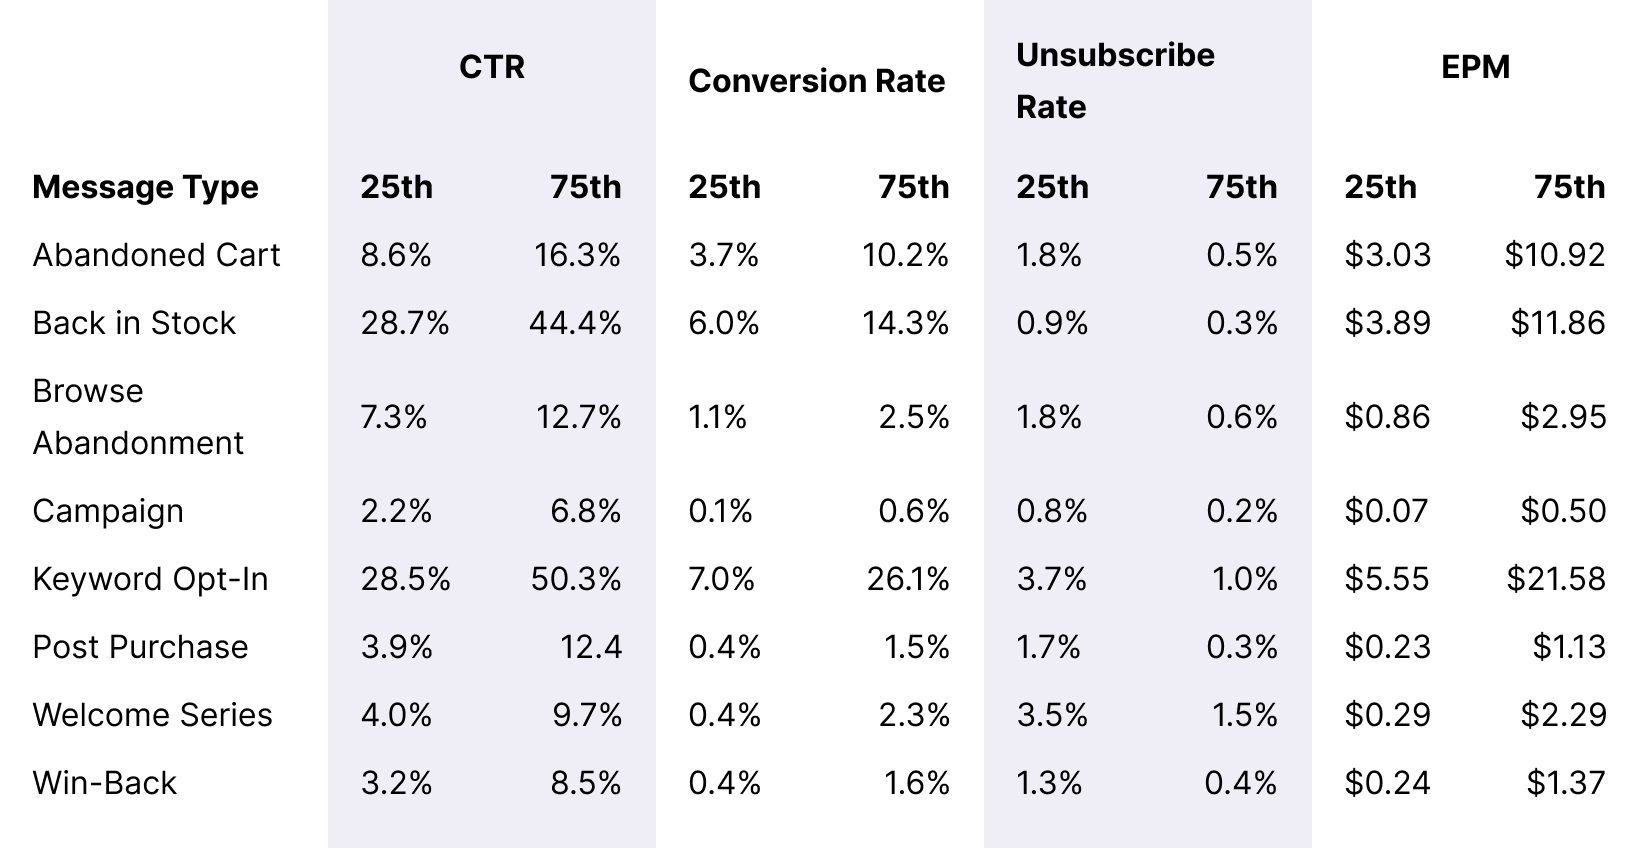
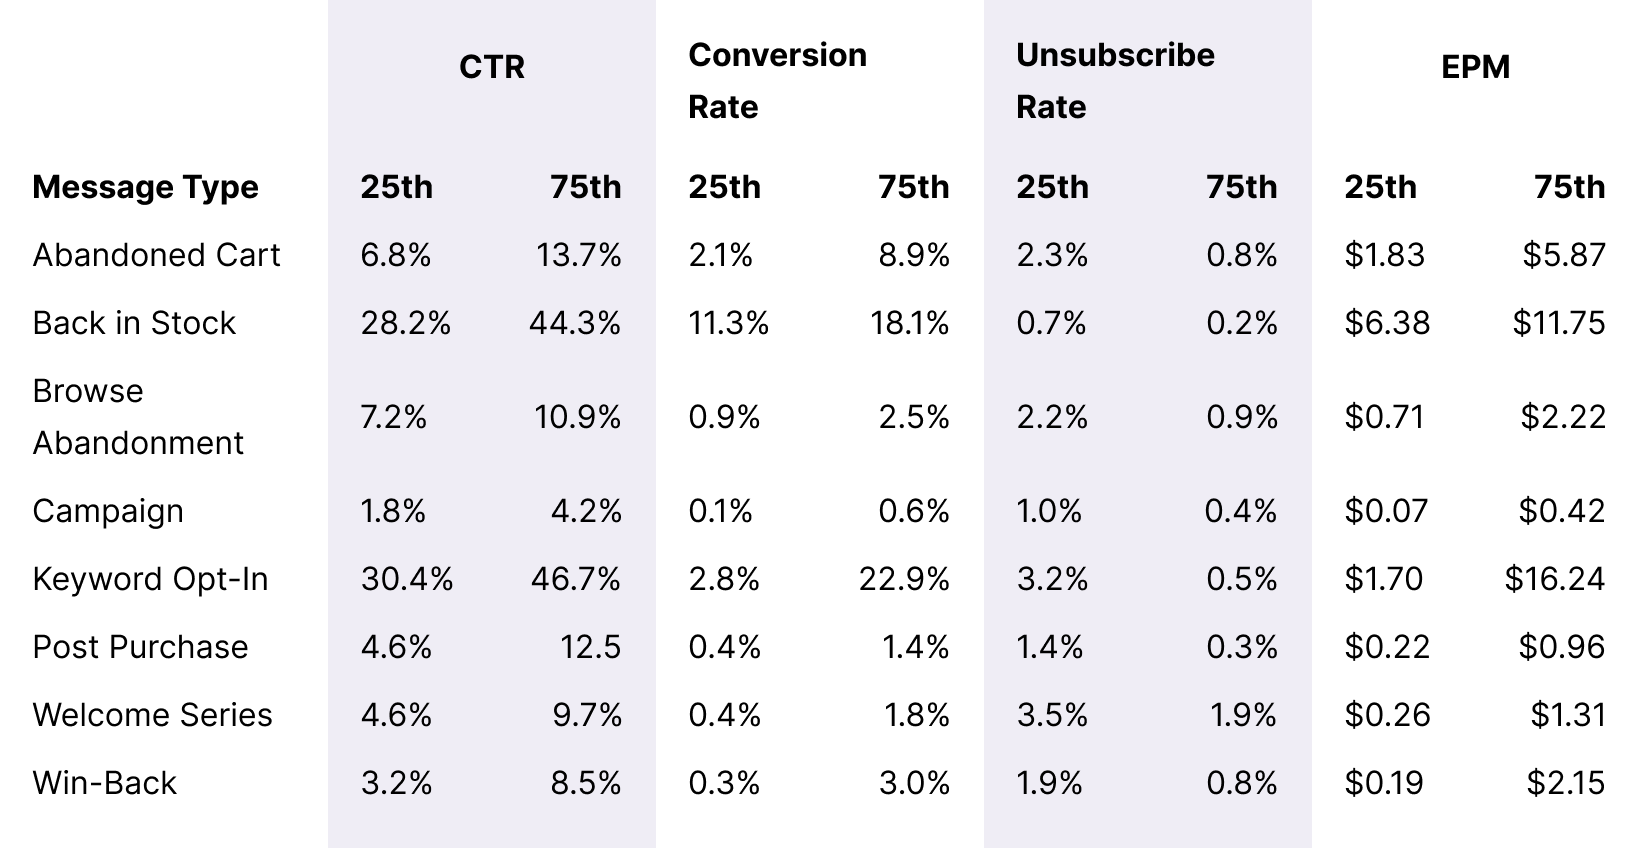
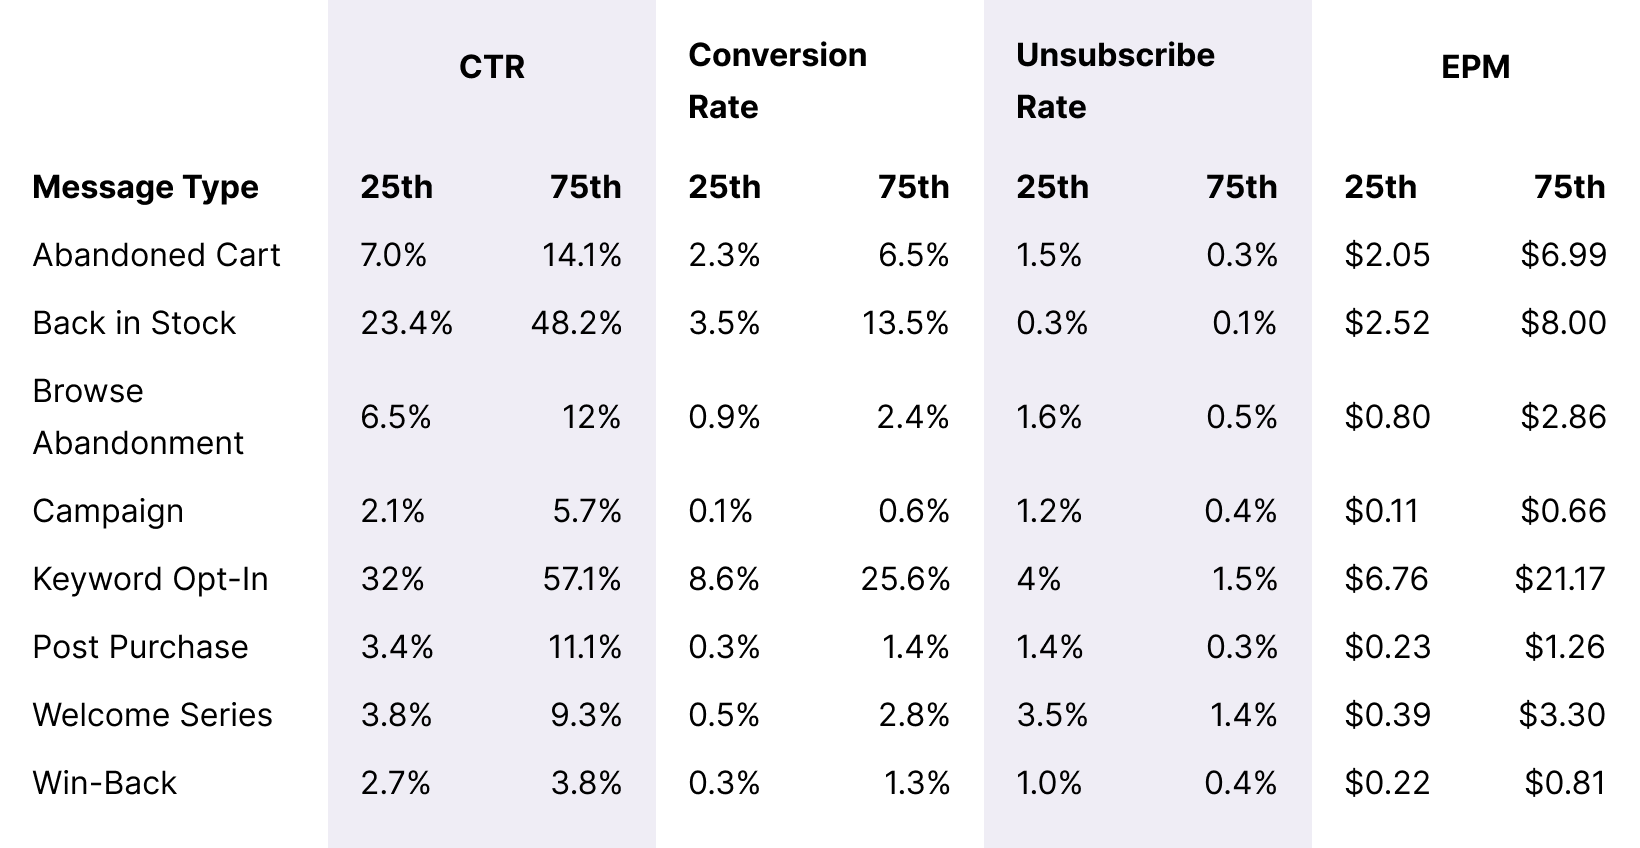
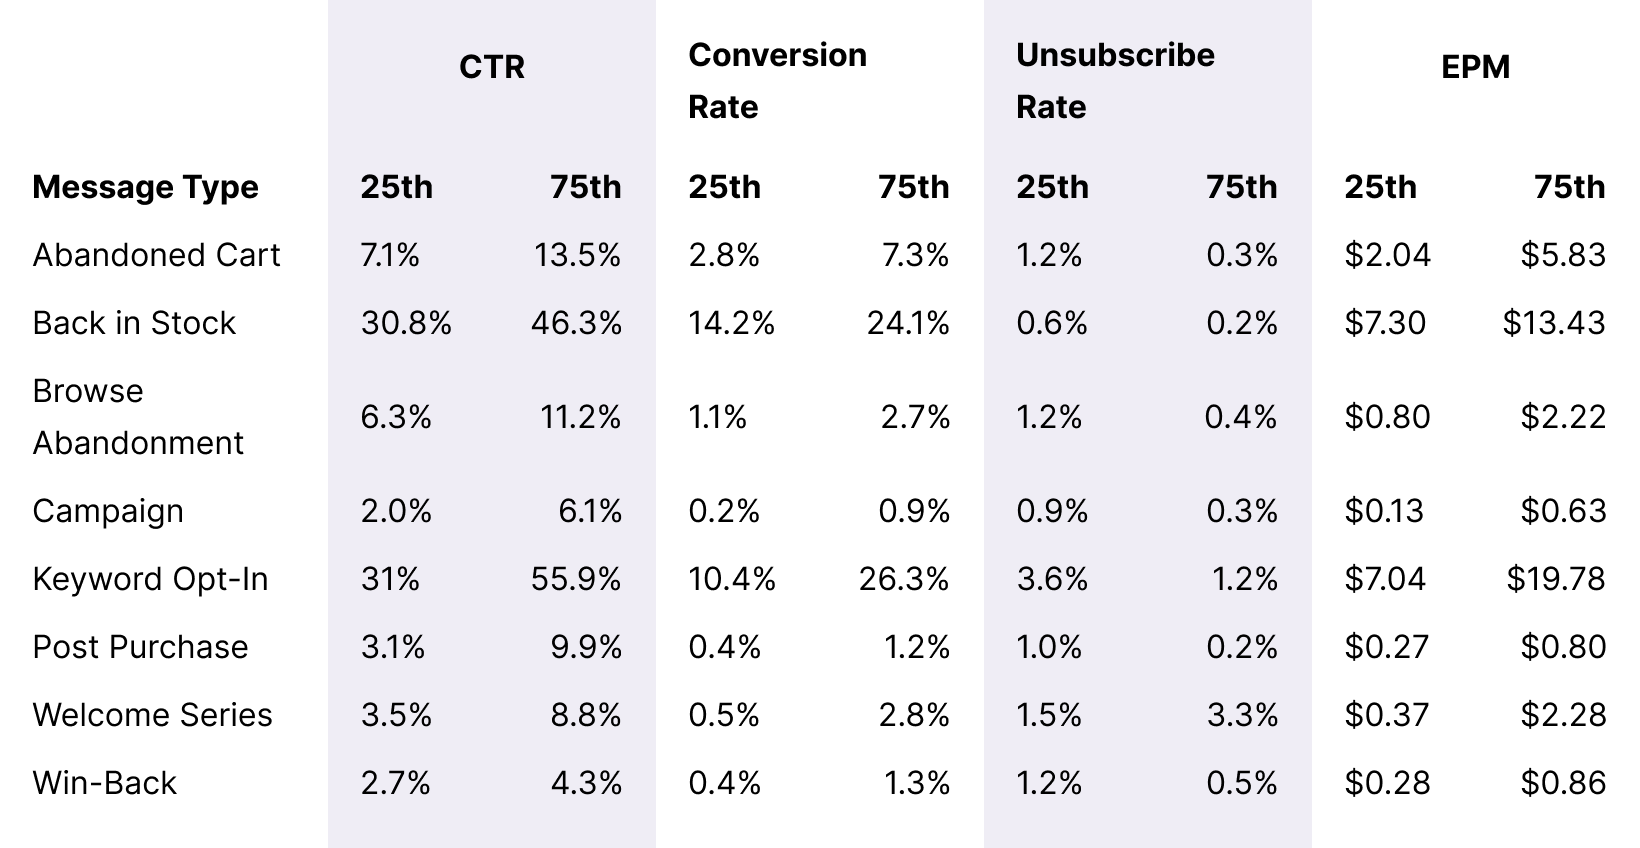
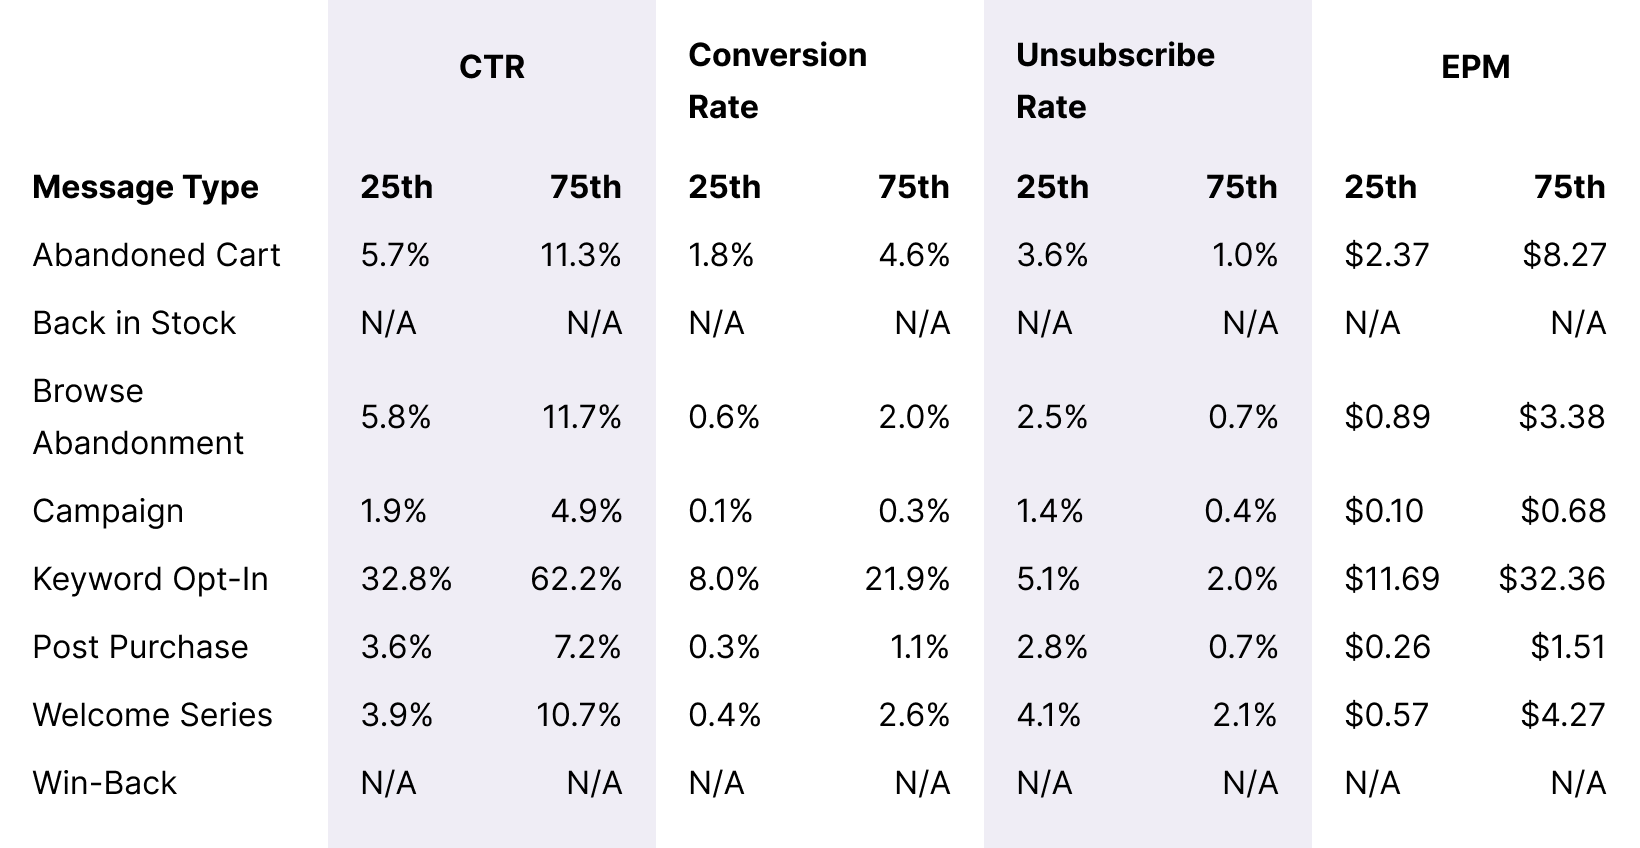
Overall Message Benchmarks
Key Takeaways
Fashion and apparel brands saw exceptionally strong performance with Campaigns and Post-Purchase automations compared to other industries. Be sure to optimize these messages even further by creating iterations that target specific segments of subscribers—based on products purchased or amount spent, for example.
Leverage Keyword Opt-in to target specific customer segments to increase an already high EPM and target Keywords based on apparel preferences (casual, dressy, etc) and deliver highly personalized Welcome Series from there.

Beauty & Cosmetics
We love a good GRWM. If your beauty brand’s SMS strategy could use a glow up, start here.
SLTV + ARMR Benchmarks

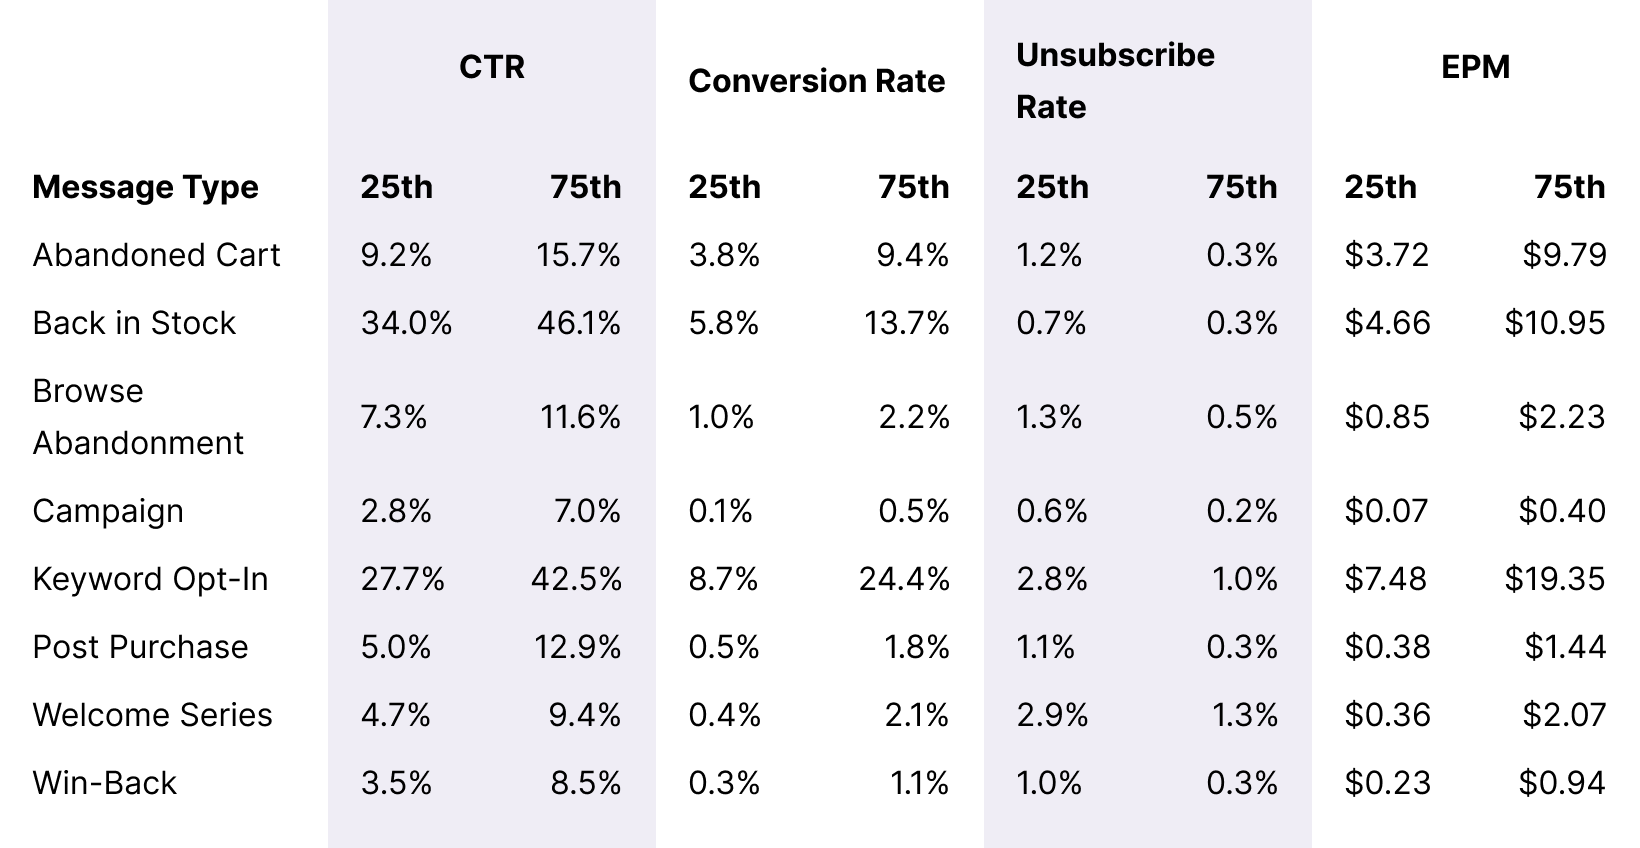
Overall Message Benchmarks
Key Takeaways
Don’t depend on only email for sending ‘back in stock’ notifications, as this SMS automation performs incredibly well for the beauty industry. Not only does it drive new SMS signups, but it is high-converting too.
We’re seeing more beauty brands use the Post Purchase automation to collect user-generated content via incoming MMS. It’s a great way to engage with subscribers after they’ve made a purchase and collect visual, social proof.

Home Goods
Home is where the heart is, so set your heart on these Home Goods benchmarks—they won’t lead you astray.
SLTV + ARMR Benchmarks

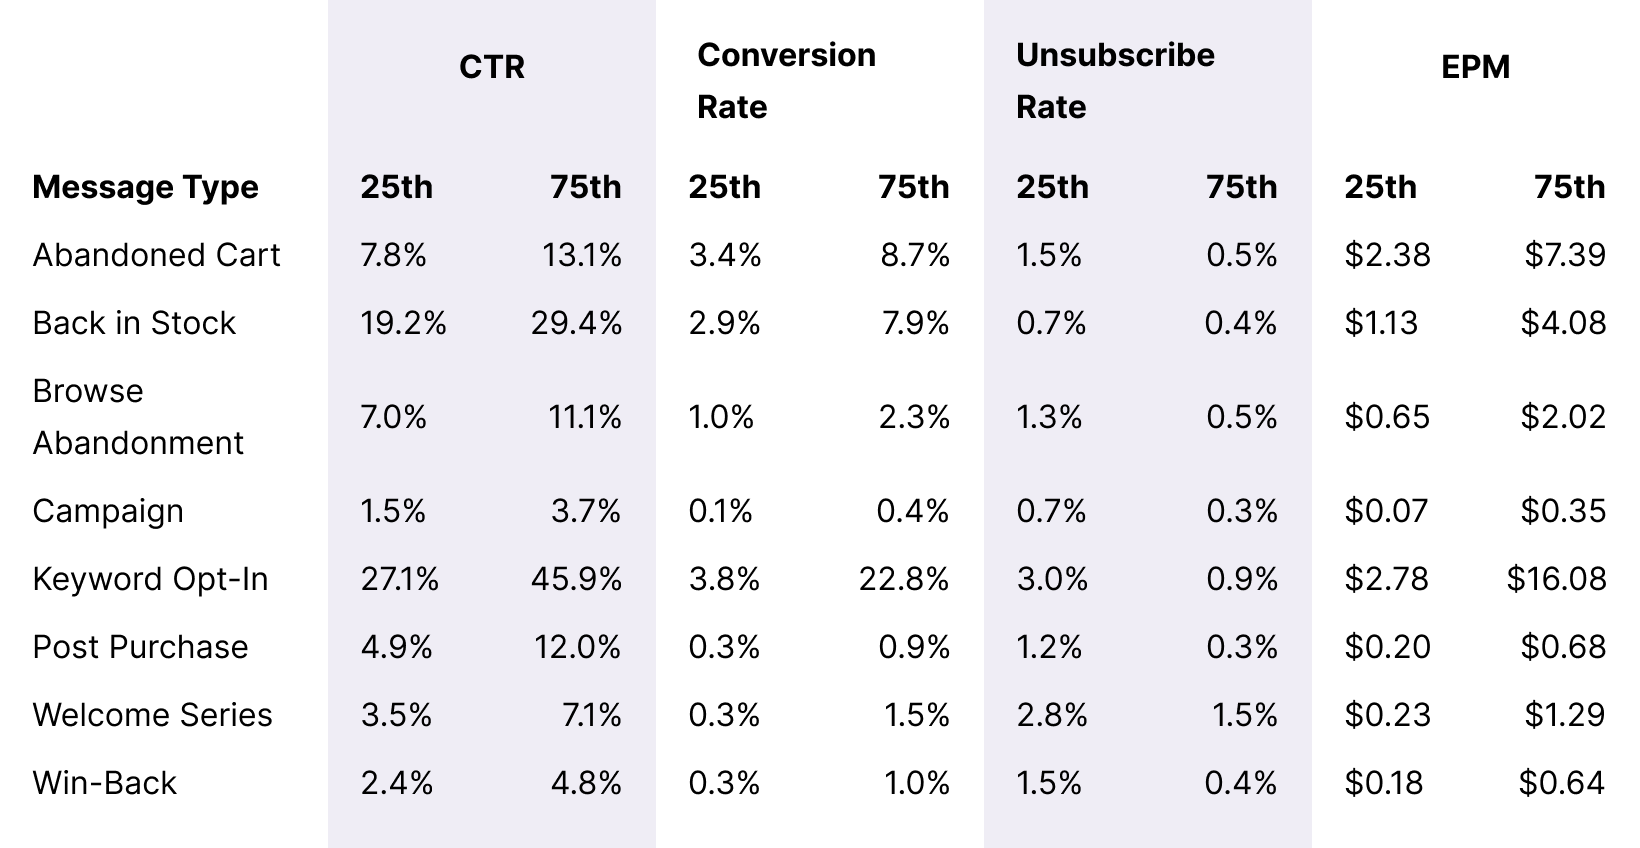
Overall Message Benchmarks
Key Takeaways
The average Subscriber LTV for stores in the 90th percentile increased by 40% YOY. If you spent the last year focusing on SMS as a revenue channel, you’re likely seeing the benefits in your SLTV score. Better yet—take this as a sign to double down in 2024.
Make sure you’re leaning into both a Browse Abandonment and Abandoned Cart automation which perform almost neck-and-neck across this industry.

Food & Drink
This section is for all purveyors of coffee, snacks, and meal prep products. Has your strategy earned you a chef’s kiss?
SLTV + ARMR Benchmarks
Overall Message Benchmarks
Key Takeaways
Do not sleep on your ‘back in stock’ notifications being turned on for SMS. Not only do we see incredibly high CTR performance, but it remains one of the top EPM opportunities too.
Keyword Opt-in continues to perform as a top message type both for CTR and EPM. If you don’t have a customized Keyword to acquire subscribers yet—create one ASAP. Consider a custom one for a specific product category, i.e. “Snacks” and deliver a specific Welcome Series depending on the Keyword to see even better EPM performance.

Health & Wellness
Does your shop cater to consumers’ mental and physical well-being? If so, consider this section your annual checkup.
SLTV + ARMR Benchmarks
Overall Message Benchmarks
Key Takeaways
Health & Wellness saw explosive growth in Subscriber LTV—up 38% for shops in the 90th percentile. The brands performing well here offer up a solid mix of educational campaigns and automations, making sure new customers have strong product knowledge and information surrounding their offerings.
This industry has one of the highest revenue per message averages, with only high AOV categories like Home & Lifestyle performing better. Make sure you’re optimizing your revenue with regular sends. Try adding 1 more campaign a month to see what kind of lift in revenue you can achieve.

BFCM Benchmarks
We gathered data for our BFCM benchmarks defined as messages sent from 11/19/2023 through 11/28/2023.
Automation Type / Campaign Benchmarks
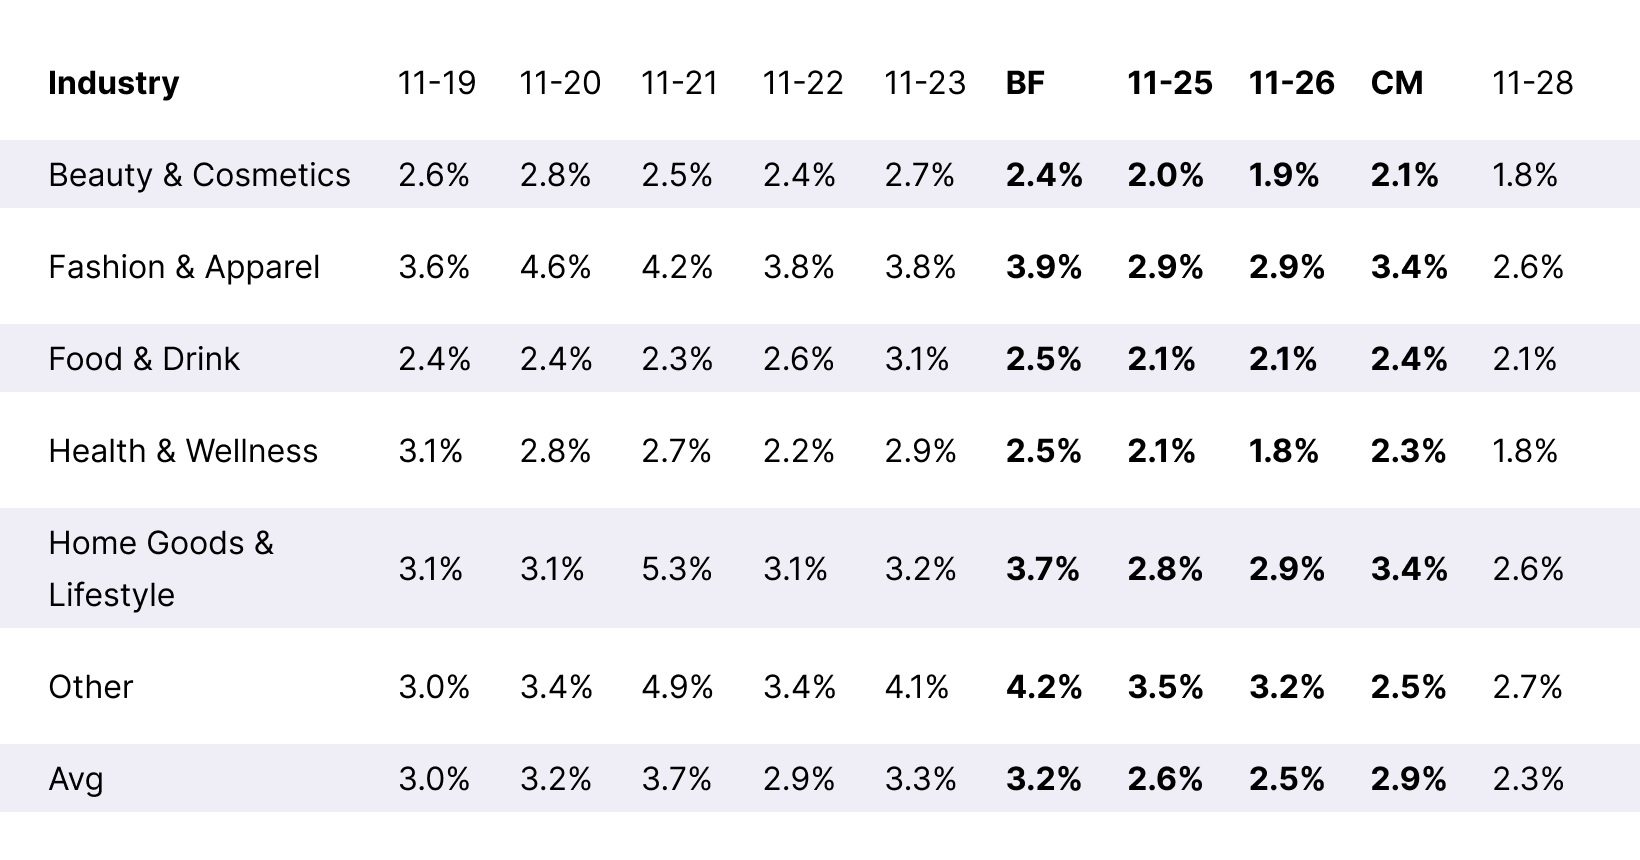
A Daily Campaign CTR / EPM Breakdown During BFCM
50th Percentile CTR
50th Percentile EPM
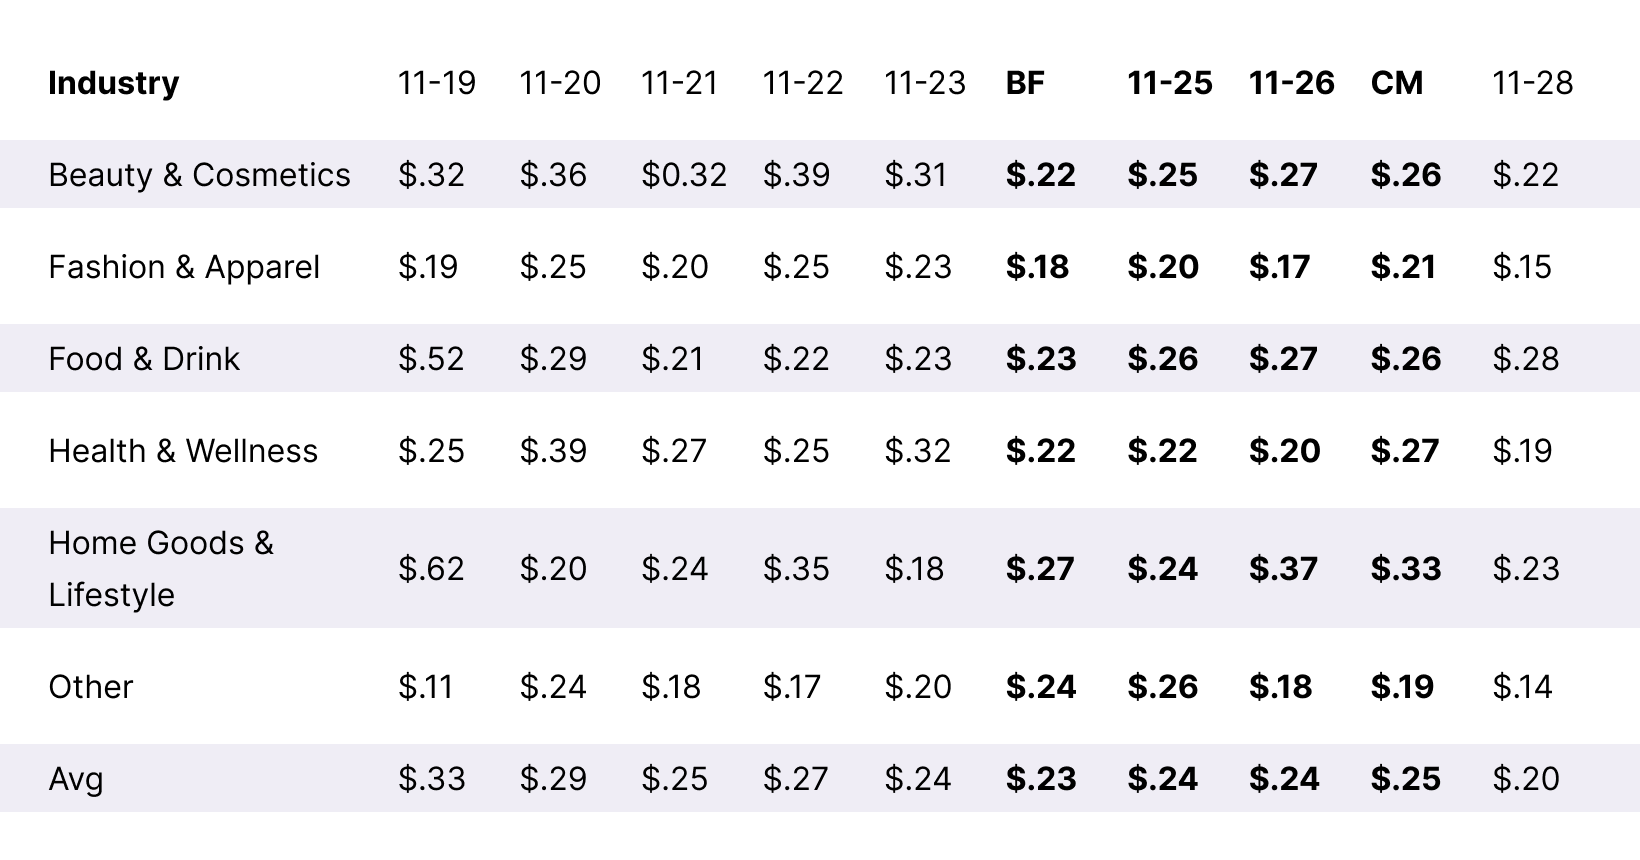
Key Takeaways
Rather than compete against brands sending on peak days like Black Friday and Cyber Monday, we saw an increase in performance in days leading up to Black Friday, with Thanksgiving having the highest average CTRs across the entire BFCM period.
Stagger your sends and don’t be afraid to hold your biggest sale offerings early—just be sure to let your subscribers know that a deeper discount is (or isn’t) coming for Black Friday or Cyber Monday. We saw a general uptick in messages like “BFCM Warm Up” or “BFCM Early Bird” that are worth trying in 2024.
Benchmarks by Product Personas
Purchase Frequency is calculated based on subscribers with multiple purchases


Small Subscription Spends
Defined As:
AOV: <$100
Repurchase Rate: >25%
Purchase Frequency: <45 days between purchases
SLTV + ARMR Benchmarks
Overall Message Benchmarks

Occasional Orders
Defined As:
AOV: <$100
Repurchase Rate: >25%
Purchase Frequency: >45 days between purchases
SLTV + ARMR Benchmarks
Overall Message Benchmarks

SLTV + ARMR Benchmarks

Overall Message Benchmarks

One-Time Luxuries
Defined As:
AOV: <$100
Repurchase Rate: >25%
Purchase Frequency: >45 days between purchases
SLTV + ARMR Benchmarks
Overall Message Benchmarks

SLTV + ARMR Benchmarks
Overall Message Benchmarks